
In FlowJoTM v11, graph batching is not limited to display graphs across the different samples in a groups but allows as well iterating across populations (Figure 1.1). The population batching requires the user to select the initial parent population (Figure 1.2) from the Population Panel, for which all the child populations will be iterated. Upon applying the Analysis tree selection (Figure 1.3), the ancestry of the selected population appears right above. The “View batch" button (Figure 1.4) is now set to iterate the source plot for all present child populations originating from the “Live” population as per the example below.
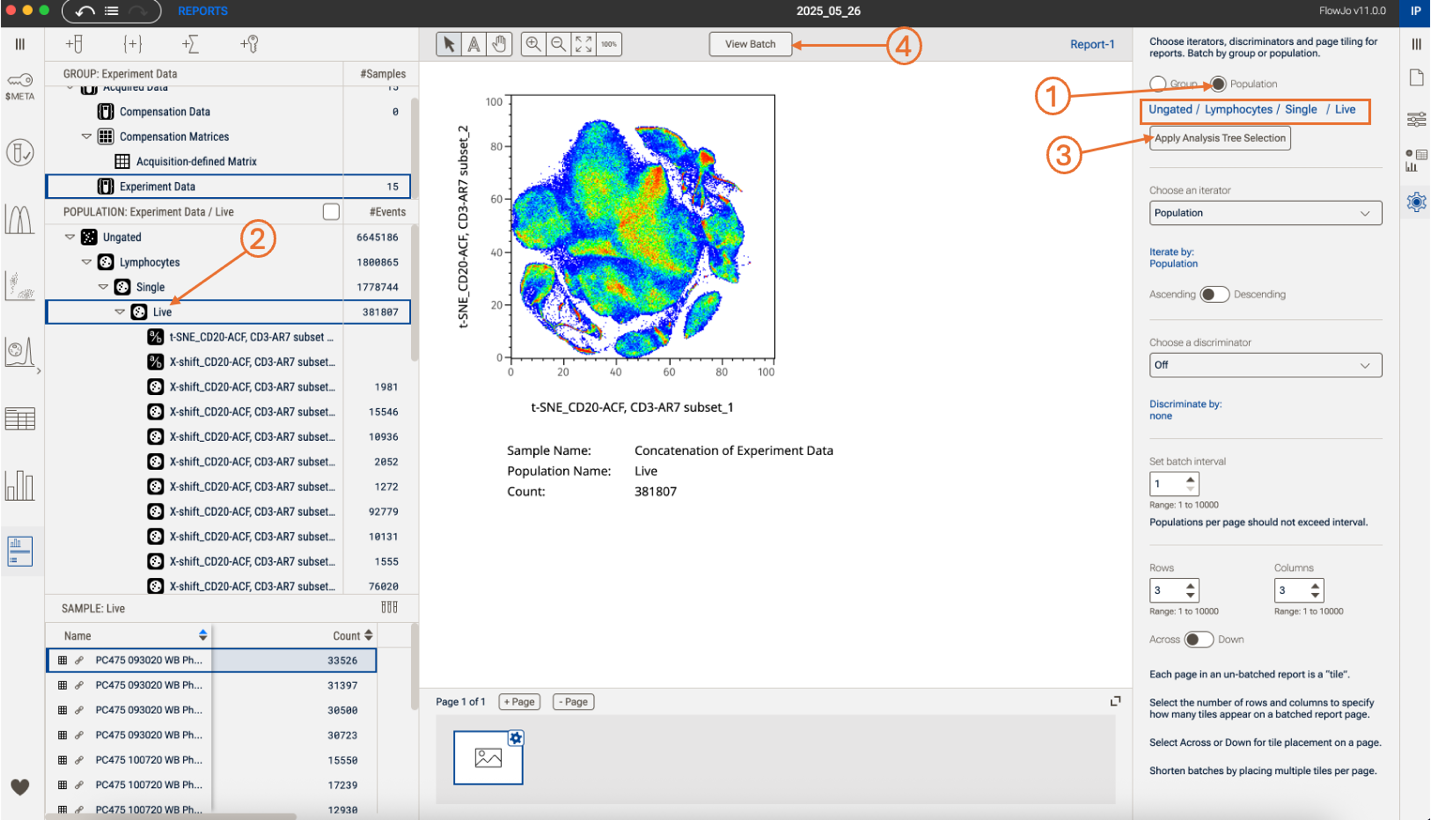
Figure 1. Setting up a population batch report in the report editor
In the example above, the “Live population” was used as input for clustering which generated multiple clusters as child populations of the “Live” parent (Figure 1.2). Using the population batching we can iterate plots where each represents one child gate (Figure 2). The batching by population can be use on individual samples as well as for VCP, including events from all the samples and batched for all child populations.
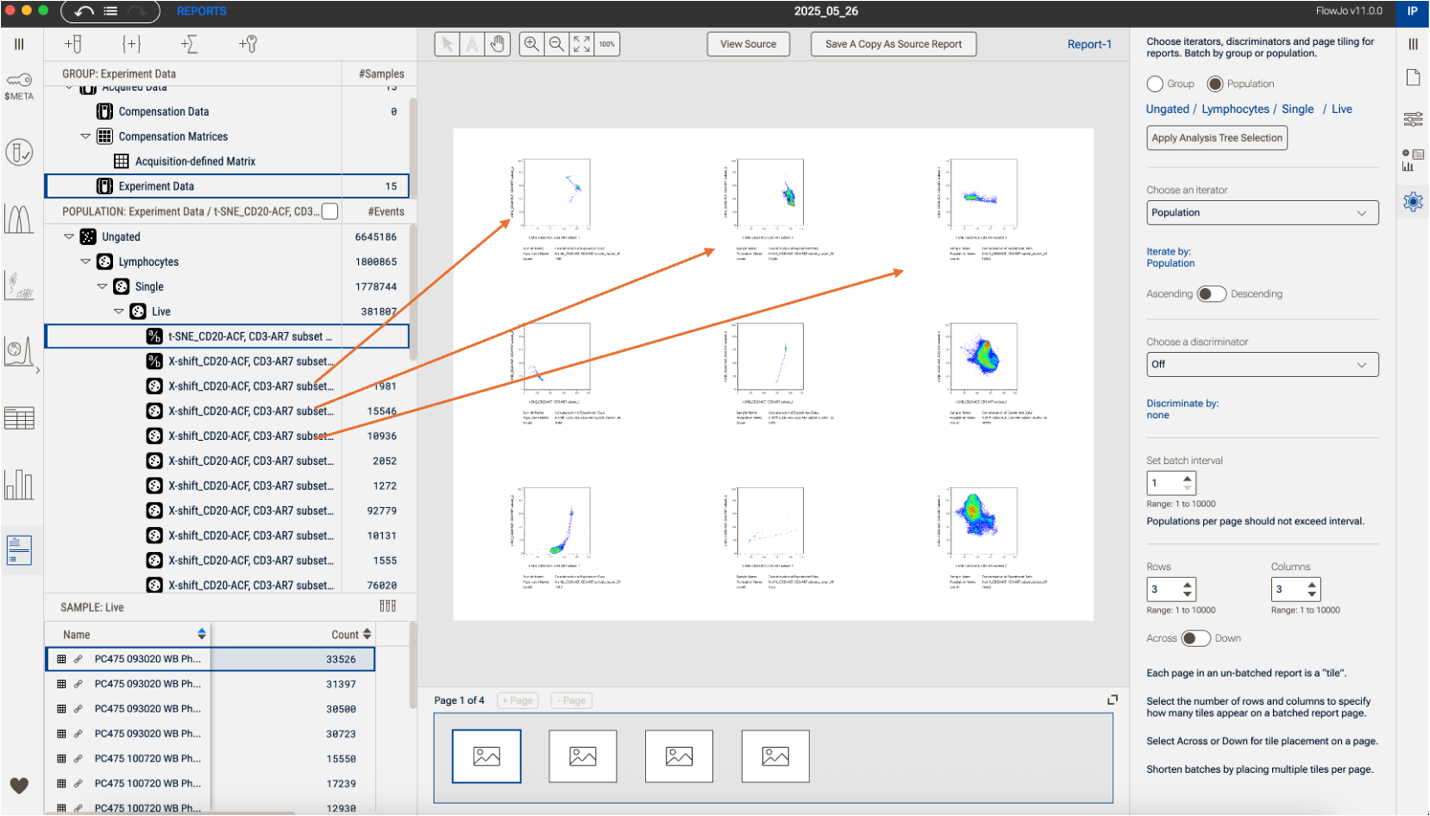
Figure 2: Batching result using the population batching option