
The Navigation Bar is the control center to choose what context will be displayed in the central panel
The navigation bar (Figure 1) is the control for choosing what tool is displayed in the Discovery panel (located in the center of the workbench), as well as in the Properties panel and Properties navigation bar (located, respectively, on the right side and far-right side of the workbench). The tools are ordered from top to bottom in the order of the expected analysis workflow, beginning with annotation in the Metadata manager, and ending with reporting via the Reports.
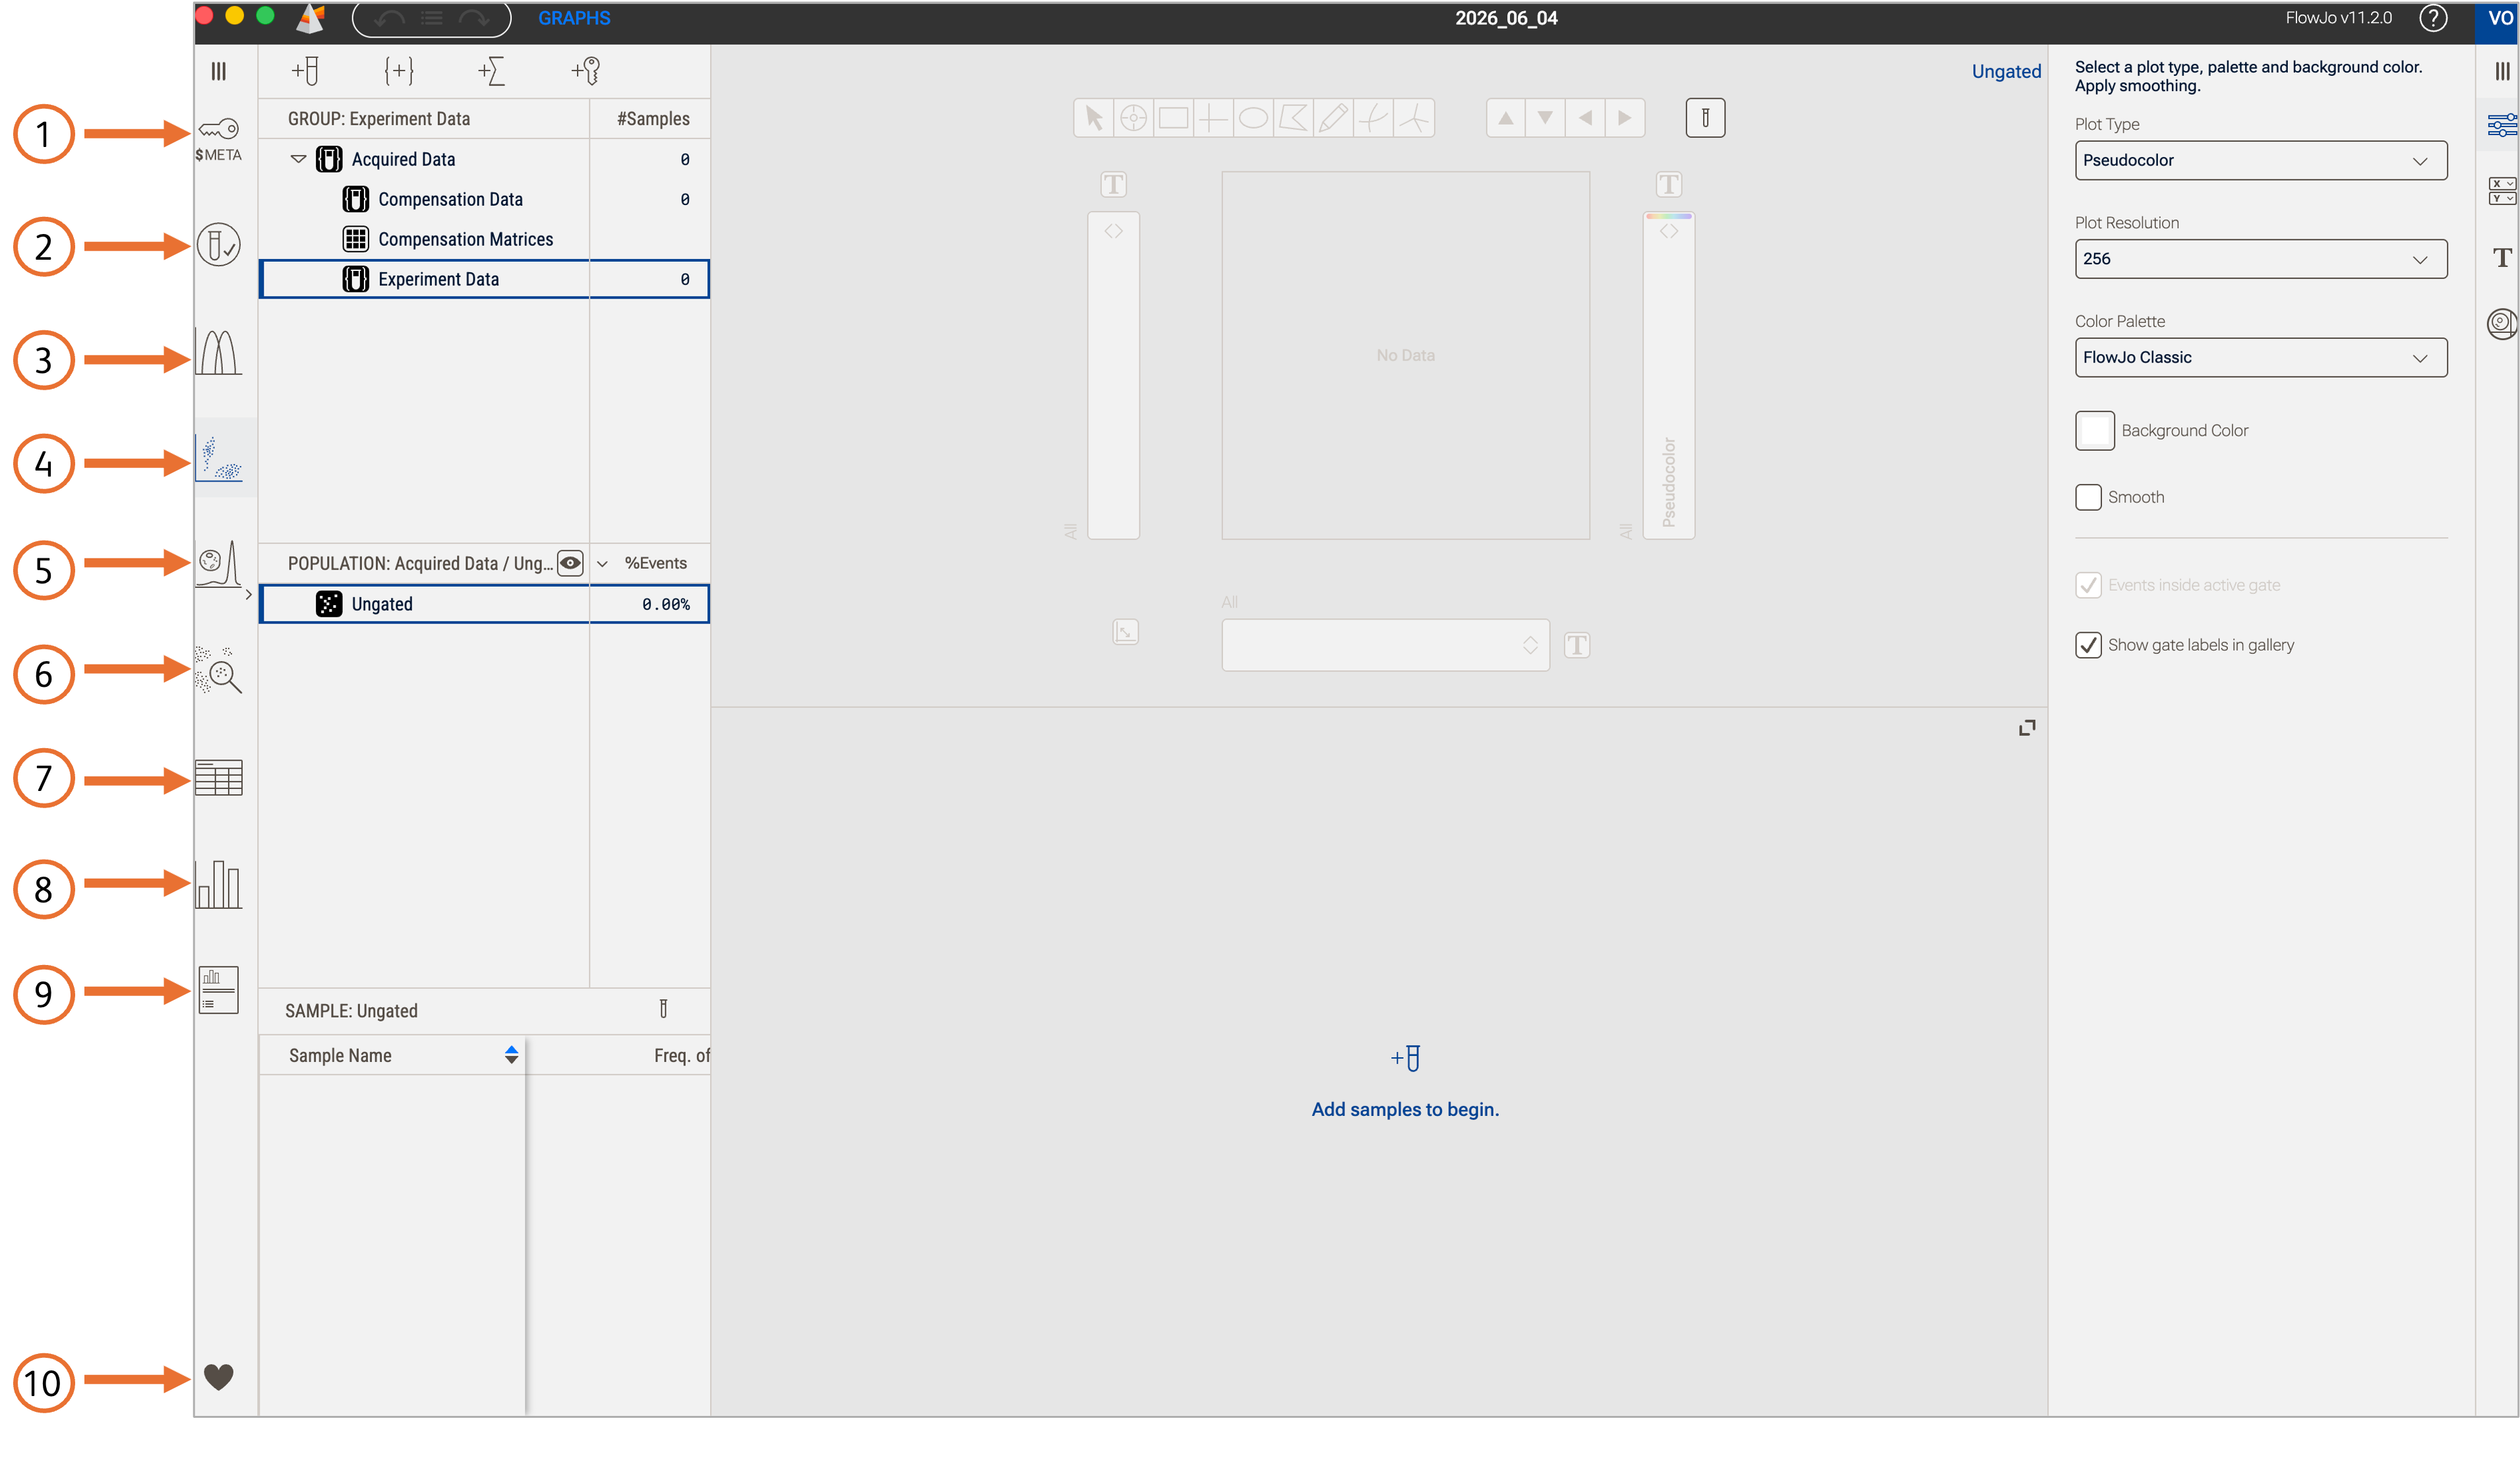
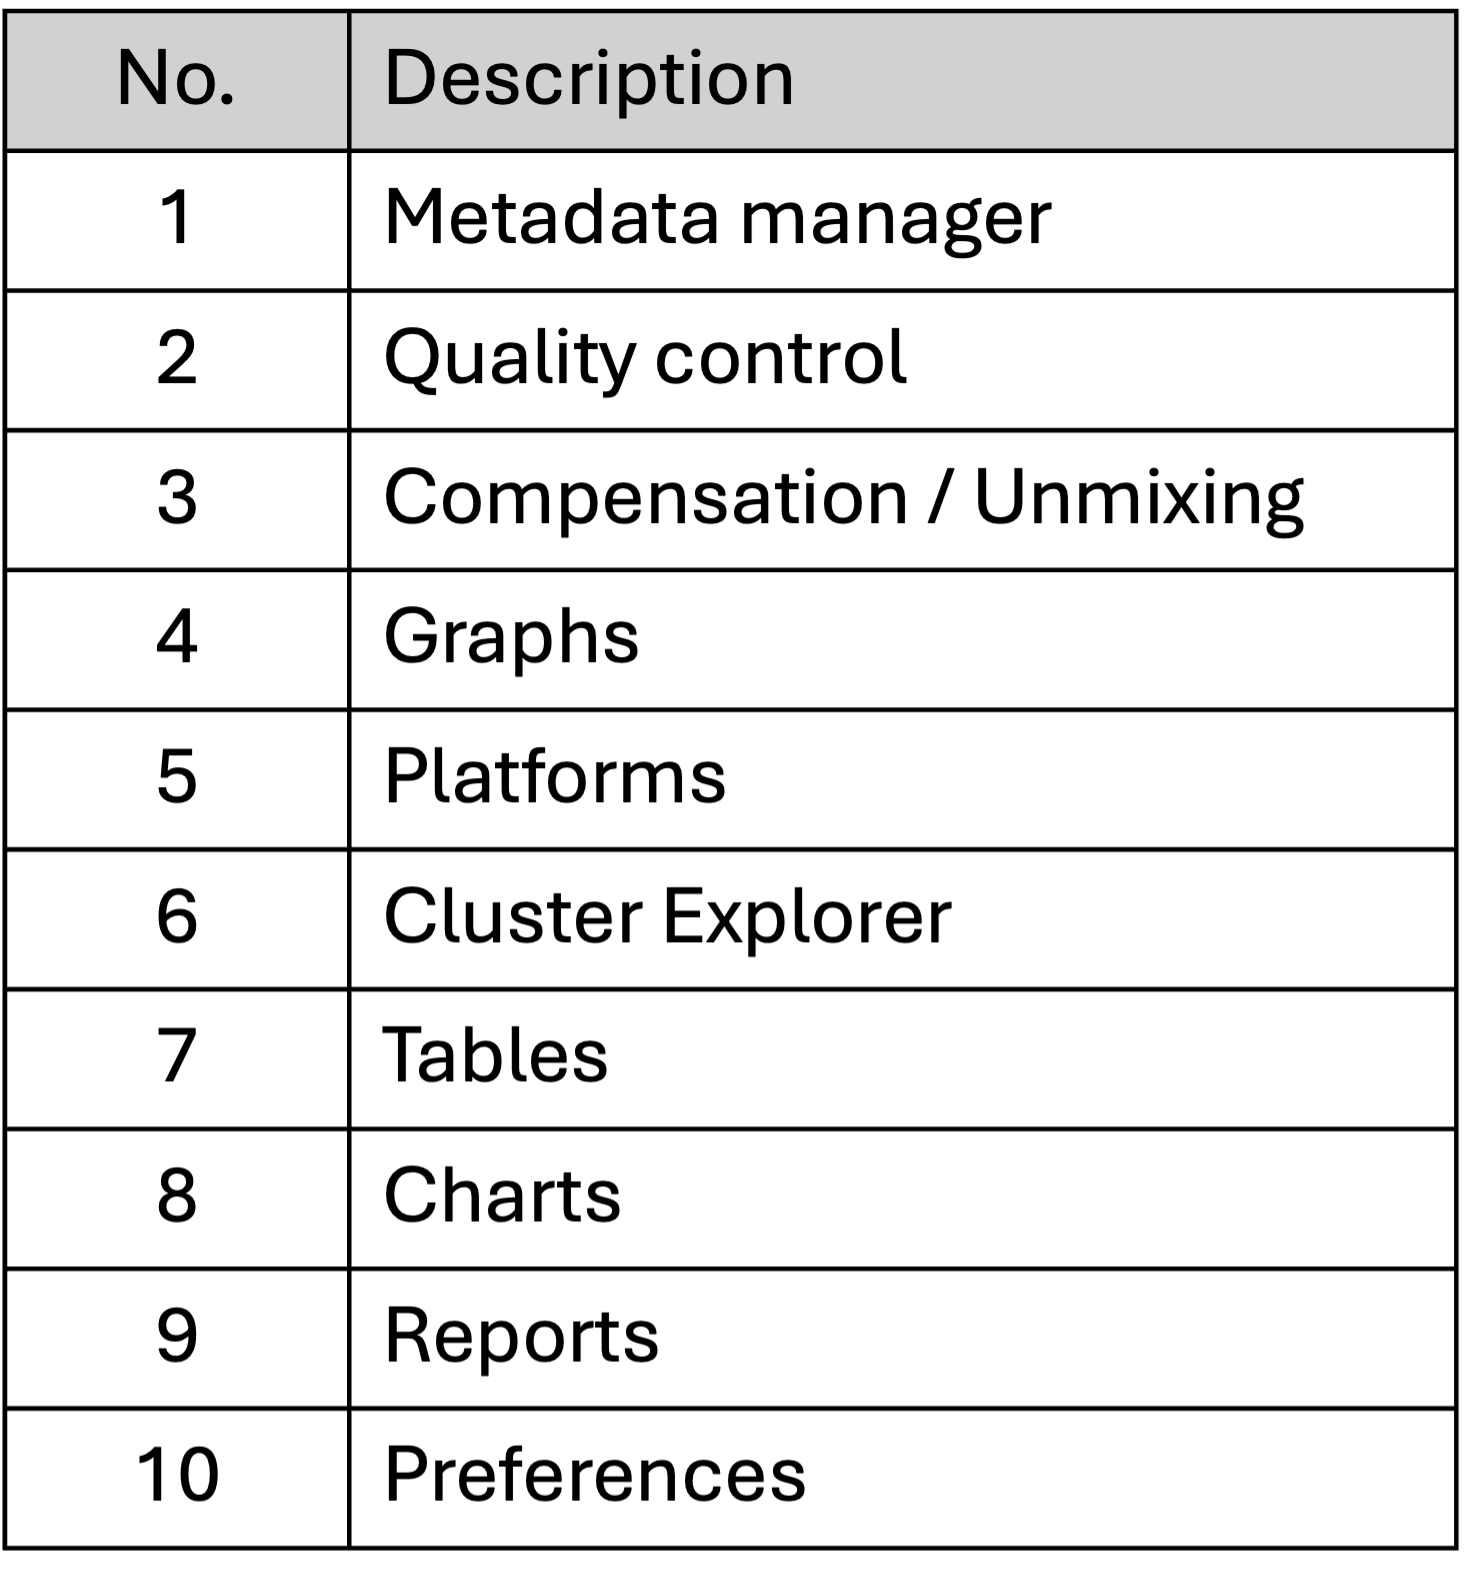
Figure 1. Navigation bar
Each element in the Navigation Bar is a Context, which include:
Metadata manager
View, modify, or add annotations to your files to improve organization. Use this interface to also modify and organize parameters.
Quality Control (QC)
Sample QC is crucial in cytometric data analysis. Despite taking care during sample preparation and instrument setup, issues could arise during acquisition. Those issues may result in altered parameter measurements and can lead to false discoveries.
Compensation / Unmixing
The compensation platform allows for post-acquisition compensation using the traditional approach, spectral unmixing, or either one ameliorated with AutoSpill. There are also options for editing a matrix and viewing metrics for spread or similarity.
Graphs and Gating
The analysis interface for data visualization and gating.
Platforms
FlowJoTM has specific analysis platforms that provide capabilities beyond the gating and statistics used for most simple data analysis. These include dimensionality reduction and clustering.
Cluster Explorer
An interactive environment for phenotyping clusters or manually-gated populations.
Tables
Tables are used to show summary statistics, sample keywords, or parameters for either exploration or reporting of results. Tables are generated and can be visualized within FlowJoTM, or exported in other formats.
Charts
Graph tabular statistics to summarize findings in a visual and easy-to-interpret manner.
Reports
Quickly generate graphical reports of all your plots, charts, and tables as well as create overlays.
Preferences
Preferences can be used to fine-tune default FlowJoTM settings to your specific analysis habits.