
X-shift1 is a top-performing clustering algorithm especially suited for discovery of rare cell populations. An advantage of this unsupervised clustering algorithm vs the others is that it automatically determines the optimal value for the Number of Nearest Neighbors (K).
X-shift is available under Platforms, within the Platform Context. When selected, the platform options will be shown in the Discovery Panel and you can proceed with selecting the parameters to use for unsupervised clustering. Once the clustering algorithm finishes calculating it will produce sibling populations as children of the population selected for clustering. These outputs can then be used to further analyze and interrogate the primary population of interest.
How to run X-shift in FlowJoTM v11
After the platform panel is displayed (Figure 1), select which parameters will be used for the X-shift calculation. You can filter the parameters by choosing a parameter set (Figure 1.1). If your data is fluorescence-based, make sure to choose only compensated parameters (denoted by the Comp- prefix)(Figure 1.2).
Adjust settings (optional). Defaults have been provided as a starting point and should be acceptable for many data sets (see below Technical Options for more information).
Choose a downsampling method (Optional): None, Random or Uniform (more information about downsampling available below) and the Total number of events: the range is from 2 to 10000000 (Figure 1.4).NOTE: Based on the number of events selected in the downsampling option, a preview of the percentage of events used to run the algorithm will be shown. This percentage is relative to the total number of cells included in the selected population. If you want to include the same population from multiple samples in the group, make sure to have VCP on.
Initiate the calculation by clicking Submit (Figure 1.5). The algorithm will run on the input population selected, using the defined options. The Platform will create clusters as new populations in the populations panel.
Technical options:
Distance metric: Eculidean or Angular. X-Shift can work with any distance metric that satisfies the triangle inequality. The default is Angular distance where [x – y] represents the angle between vectors x and y.
Number of Nearest Neighbors (K) : It is automatically determined. However, a manual value can be used by typing it in, or by using the up and down arrows to increase or decrease the value. The range goes from 3 to 1000. If less than 1000 events, the max k value can’t be higher than the number of events selected.
Downsampling method: Downsampling reduces the number of events choosing cells throughout the selected parent population. There are two available methods to reduce the number of events taken in account for the calculation. Uniform or random will either take events regularly across the order of events (usually ordered by time of collection), or randomly.
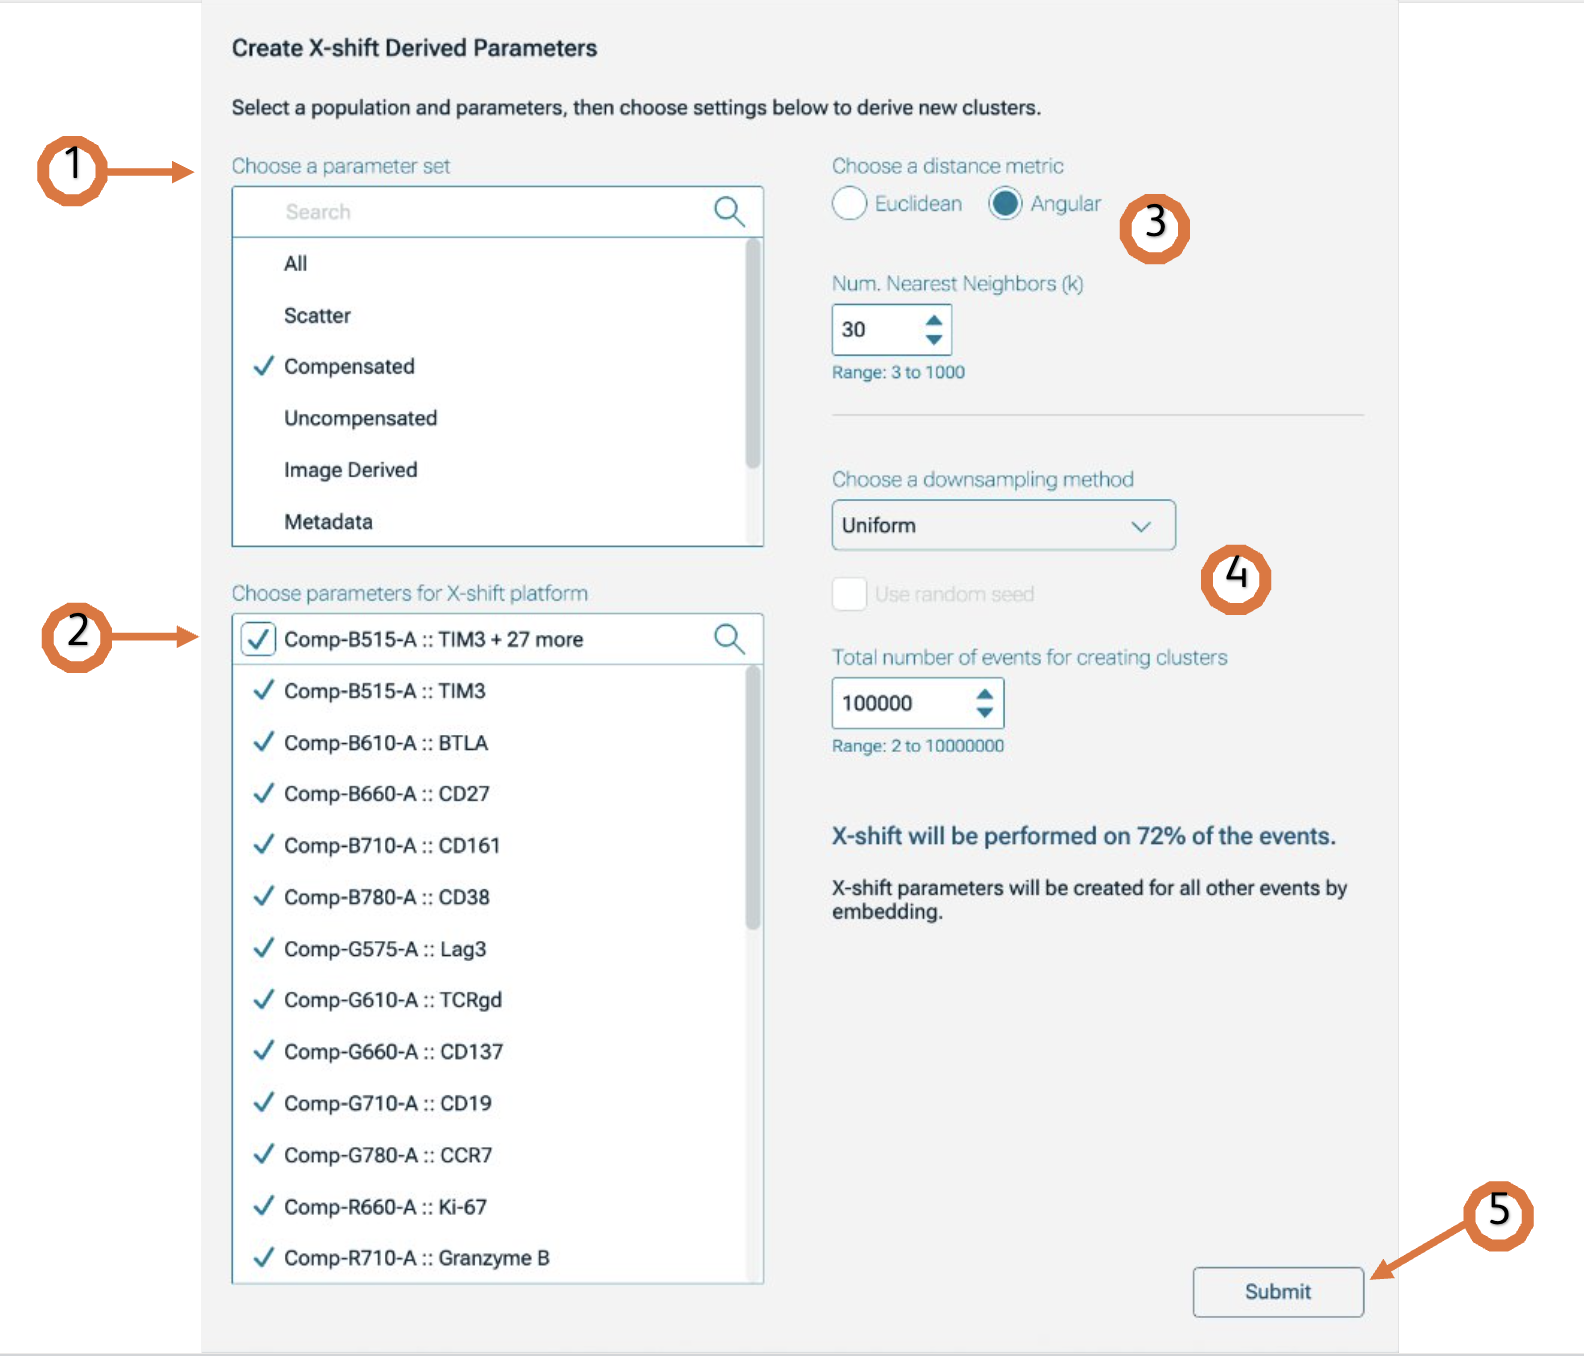
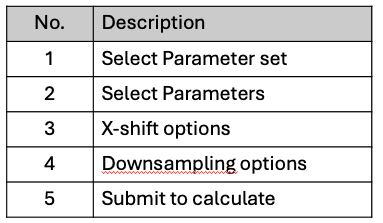
Figure1. X-shift platform
- Samusik N, Good Z, Spitzer MH, Davis KL, Nolan GP. Automated mapping of phenotype space with single-cell data. Nat Methods.13(6):493-6 (2016).