
The Population Panel displays all the populations (gates) associated with the selected group and whether those populations are uniform for the group. A population is created by drawing a gate on a sample, or by running an algorithm that automatically creates them.
Group ownership of populations
In FlowJoTM version 11 all populations are associated with a group. If a sample is part of a group, it has all of the gates associated with that group. Any individual sample's populations may be adjusted by modifying the gate drawn on it. Populations that include samples with modified gates are indicated in bold. In the example below, the T-cells population includes a sample with a modified gate.
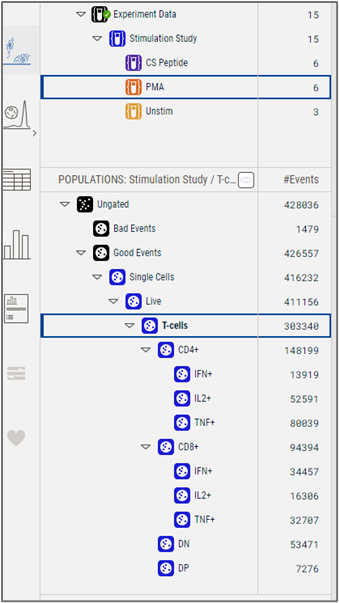
Figure 1. The Population Panel
Populations are colored based on group ownership. In this example, the Good Events and Bad Events populations were created by running the QC platform on the Experiment Data group, hence the populations are colored black. The rest of the gates were created on the Stimulation Study group, hence the populations are colored blue. Note that populations are consistent down the hierarchy. If a population is created on a top level, or parent, group, even if the data are sub-divided into groups such as the CS peptide, PMA, and Unstim groups in this example, the downstream groups inherit all of the gates.
TIP: Take advantage of this feature by creating populations that are consistent across all experimental groups so you only have to do it once.
See-All Mode
See-All Mode allows you to visualize all the different populations created during your analysis. In the example below, the PMA group was selected and a Boolean gate of the INF+ and TNF+ populations was created to see which cells express both markers. The Boolean population appears orange since it was created on the PMA group exclusively (Figure 2a). Whether that population is displayed if you navigate to an upstream group, is controlled by the See-All populations button, indicated in it's OFF position (Figure 2b) and ON position (Figure 2c). Observe that the selected group is now the upstream group, Stimulation Study (Figure 2b,c). With See-All turned off, any gate that was exclusively created on a downstream group is hidden, to limit the display to only populations present on all samples in the currently selected group and simplify the workspace. With See-All turned on, every population is shown, and color is used to indicate which group that population is associated with.
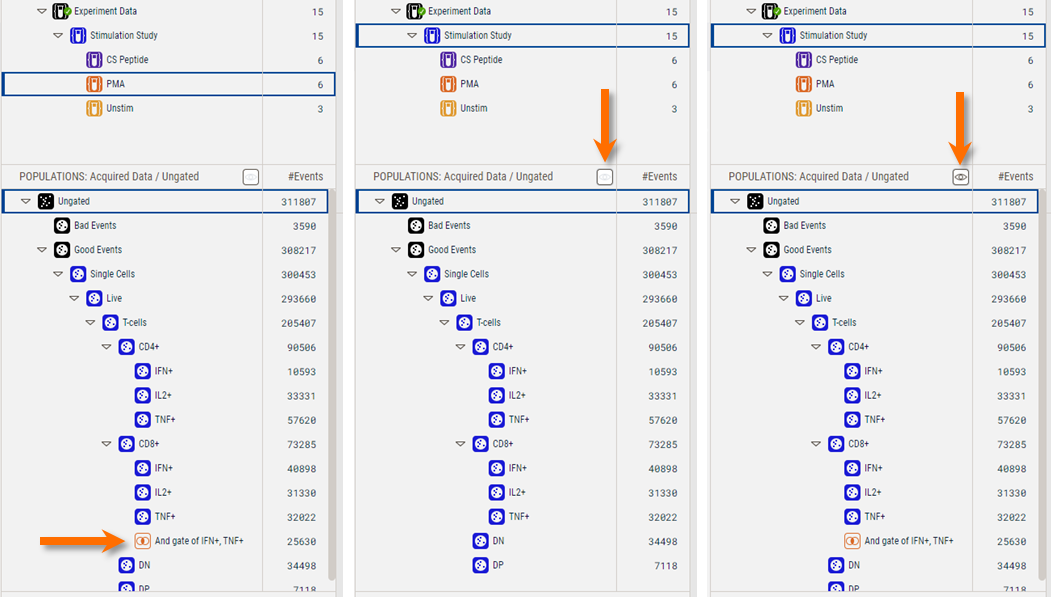
(a) (b) (c)
Figure 2. (a) Creating a population on a specific sub-group (b) See-All mode turned off while looking at an upstream group so the population created on a downstream group is hidden (c) See-All mode turned on so the population created on a downstream group is displayed.
Population Drag-and-Drop
You can drag-and-drop a population to a group, onto another population, or to an individual sample. The behavior will be a little different depending on which option you choose.
- Drag-and-drop to another population: this action is treated as a COPY.
- Drag-and-drop to a sibling group: this action will COPY the population to the top level of another group.
- Drag-and-drop to an upstream group: this action will COPY the population to the top level of the upstream group. However, if you then drag-and-drop that population to the original place in the hierarchy it will become a MOVE, because it will move ownership of the gate from the downstream population to the upstream population. NOTE: the population will still be present on the original group, but after the move it will also be present on all of the sibling groups.
- Drag-and-drop to a specific sample: To drag from one sample to another, highlight the sample in the Samples Panel that you want to drag from, then drag the gate you want from the Populations Panel to the target sample. This action will REPLACE that existing gate.
Right-Click Options
There are several useful options revealed by right-clicking on a population.
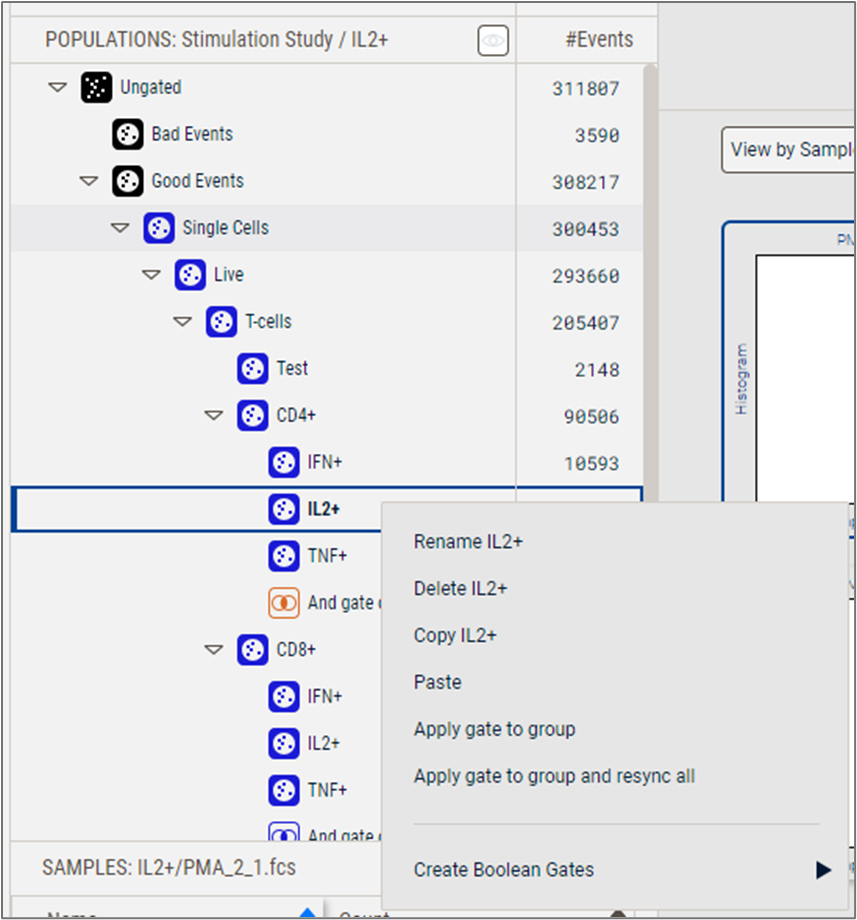
Figure 3. Population Panel right-click options.
Rename and Delete do as you would expect. Copy and Paste as well, but it's worth pointing out that using this approach saves you a step as compared to drag-and-drop. You can copy a population from one group and paste it to the exact location you would like it to go. All of the COPY / MOVE / REPLACE results are the same as if dragging-and-dropping.
Apply gate to group and Apply gate to group and resync all will only be selectable if you have clicked on a gate that has been modified (or desynchronized as in FlowJoTM Version 10). Apply gate to group makes the desynced gate the new group-owned gate, replacing all of the synchronized gates with the selection, but leaving any other desynchronized gates unchanged. The Apply gate to group and resync all choice replaces all of the gates in the group, including any desynchronized gates.
Event Statistics
In FlowJo v11.2+, click the Events column header to select the desired statistic for display (Figure 4). #Events will display the count or number of cells in the population. %Events will display the frequency of the population relative to the parent. Note: When VCP mode is on, event statistics for each population are calculated on the concatenated (or merged) samples in the selected group.
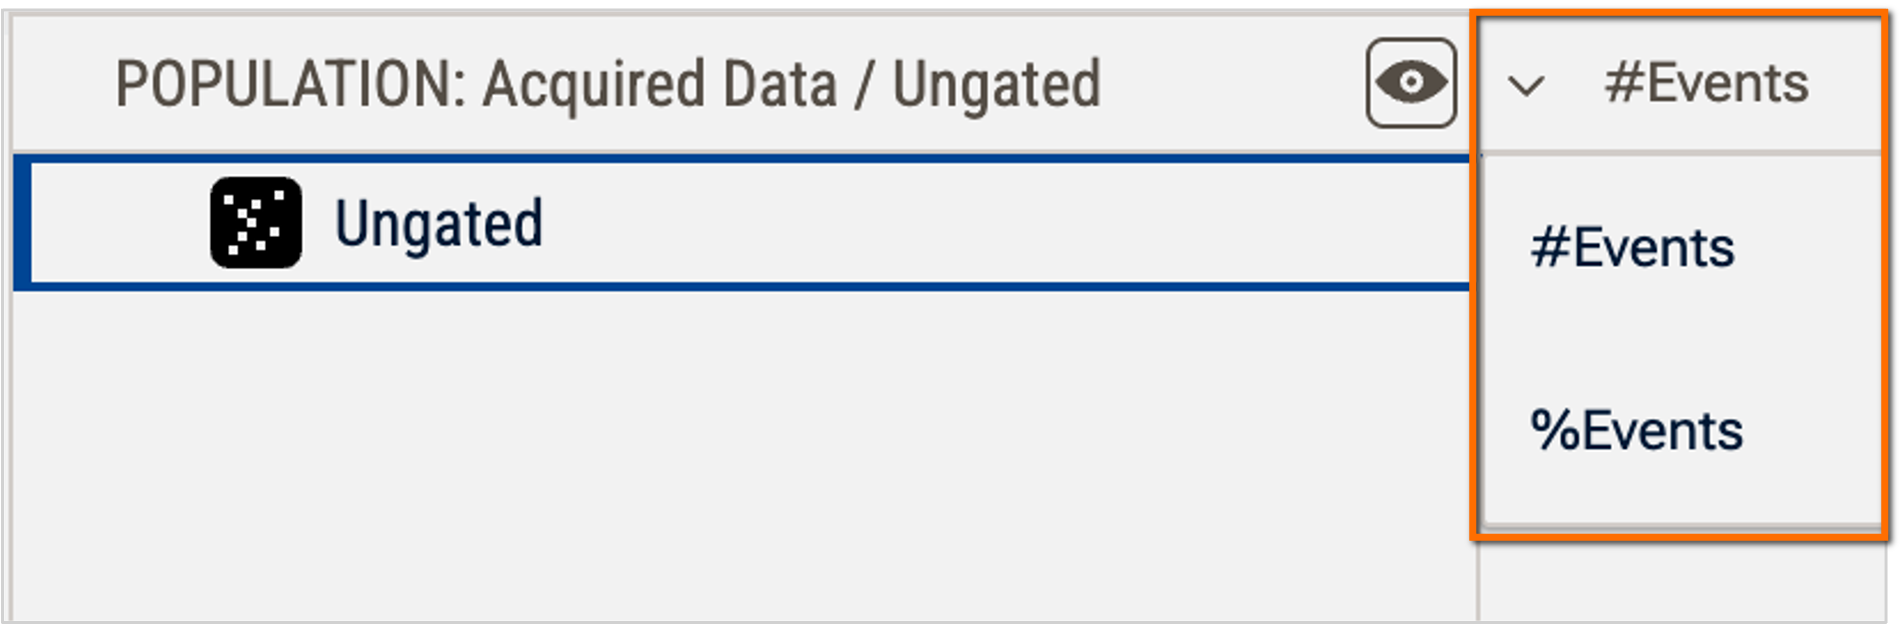
Figure 4. Event statistic options