
The report Settings (Figure 1) allow you to modify, specify and adjust parameters on the -x axis and -y axis of your plots. Multiple plots dragged into the report editor can be aligned and ordered on the given page format selected.
In order to define specific settings, you will first need to populate the report editor with one or more plots by dragging and dropping a population from the population panel into your report (Figure 1.2). Clicking on the report settings panel will open the available settings (Figure 1.1), where you can initially only order and align plots (Figure 1.3). Once you select one or multiple plots, you will then be able to also specify the plotted parameters (-X axis,-Y axis, Color map parameter) (Figure 1.4), choose from different Plot types (Dot Plot, contour plot etc) as well as Event Color and Background color (Figure 1.5).
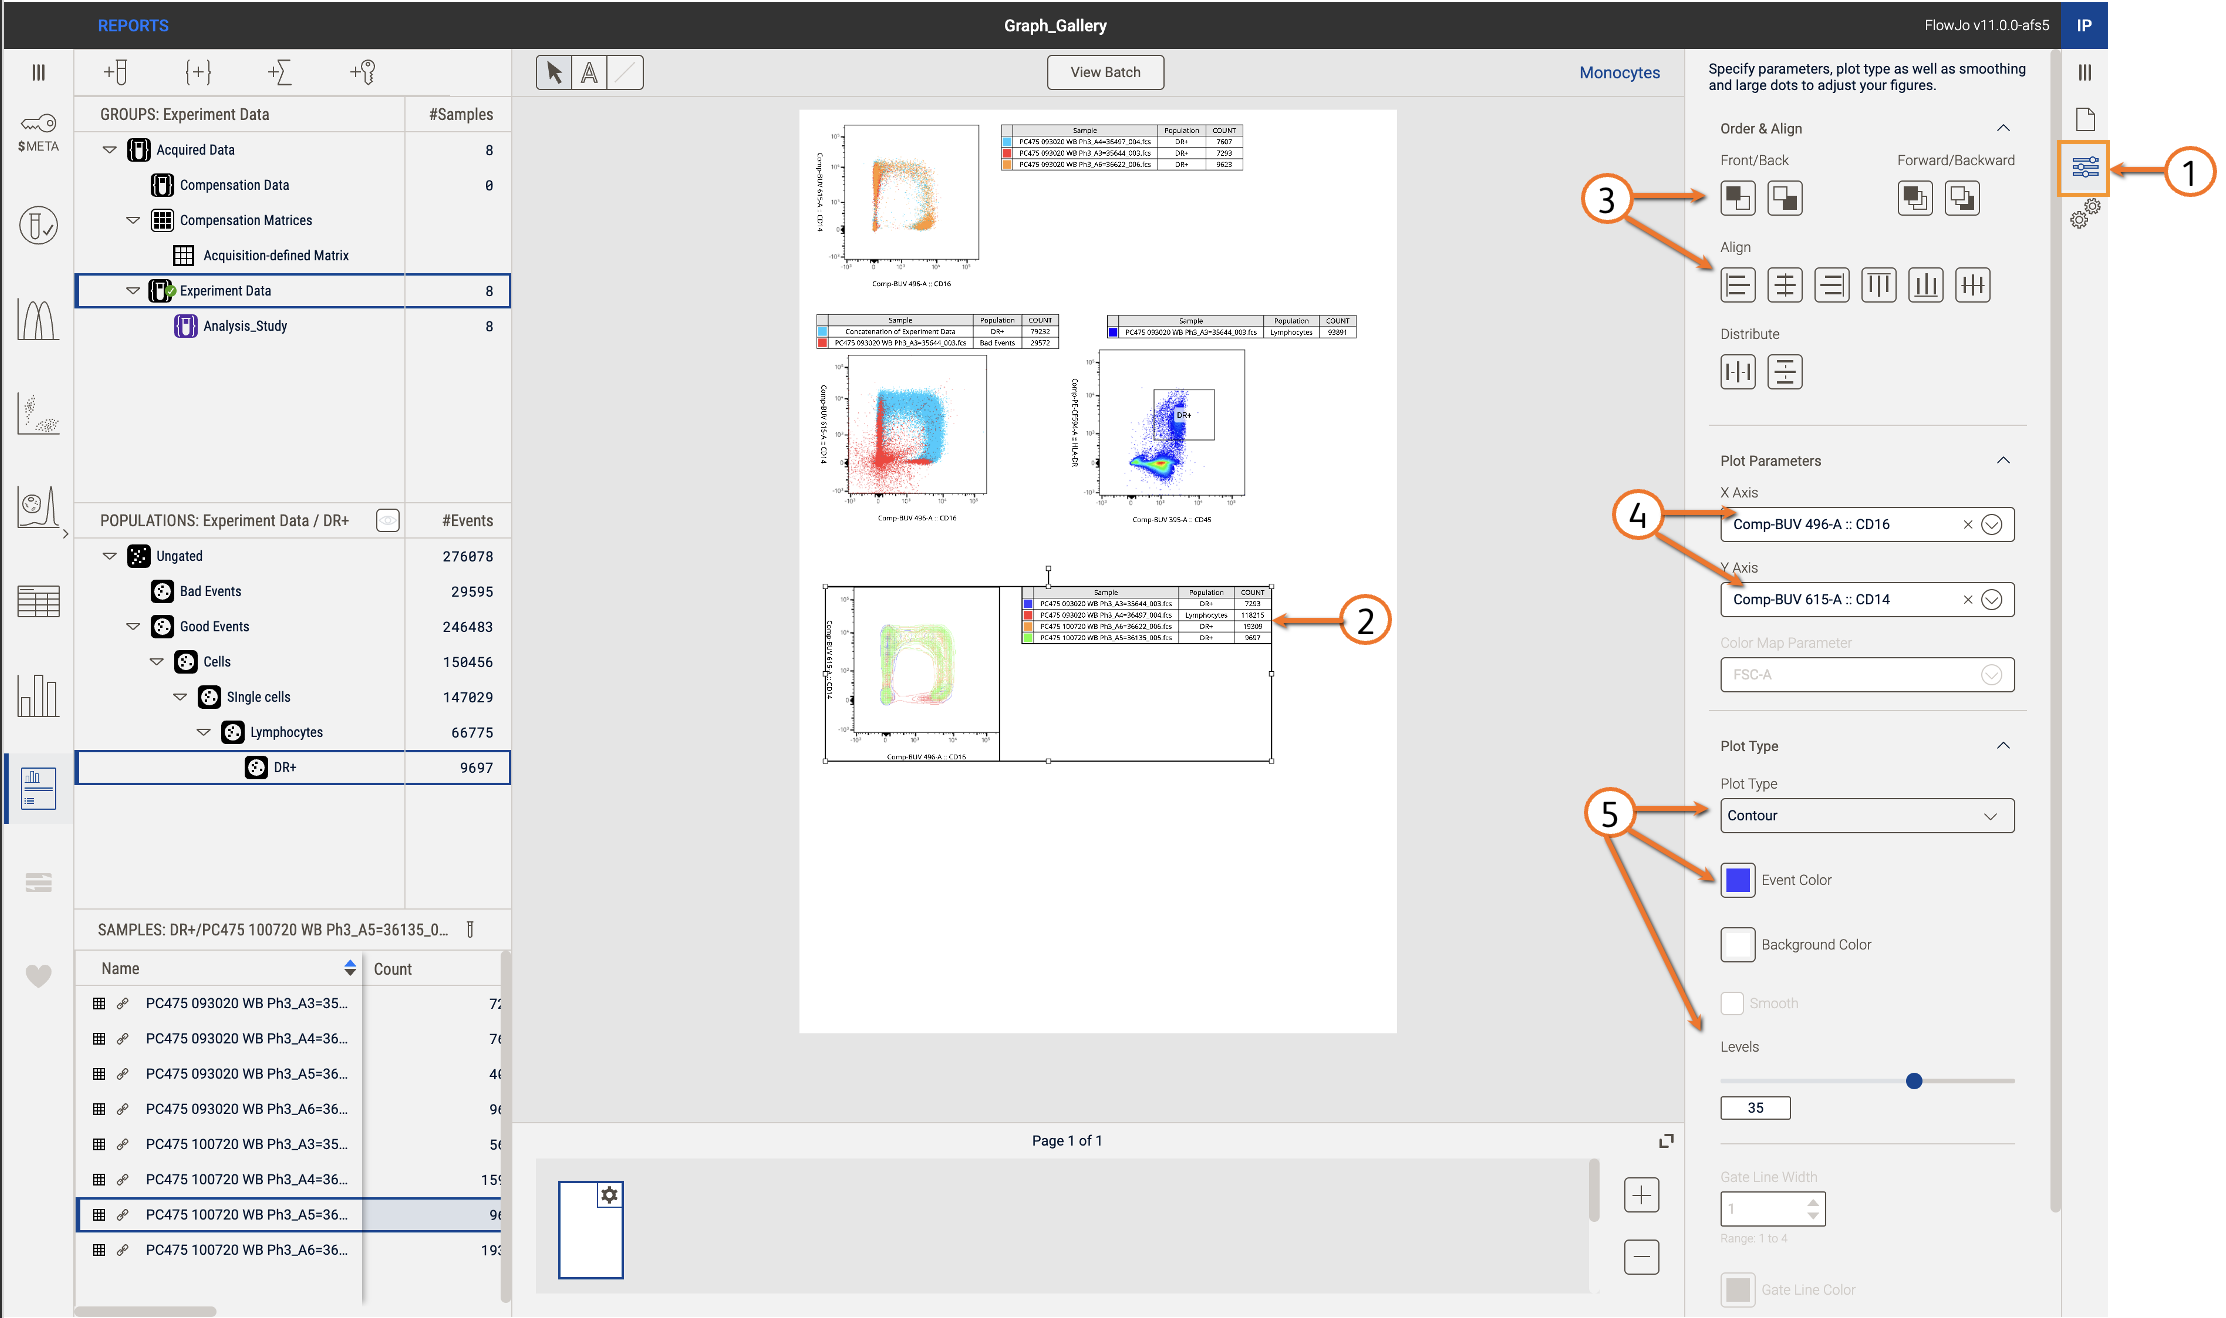
Figure 1. Available options in Report Settings