
The Group panel is the top portion of the Analysis tree. It is used to organize samples into sets for common analysis and reporting.
Almost all cytometry experiments involve collecting multiple samples that fill distinct roles within the experimental design. Some files may serve as compensation controls or experimental controls, others as fully stained experimental files, and others yet as a follow up validation experiment. Groups can be used in FlowJoTM to partition the data so that you may act on multiple files, expediting your analysis.
Groups are the basic functional unit in FlowJoTM.
Overview
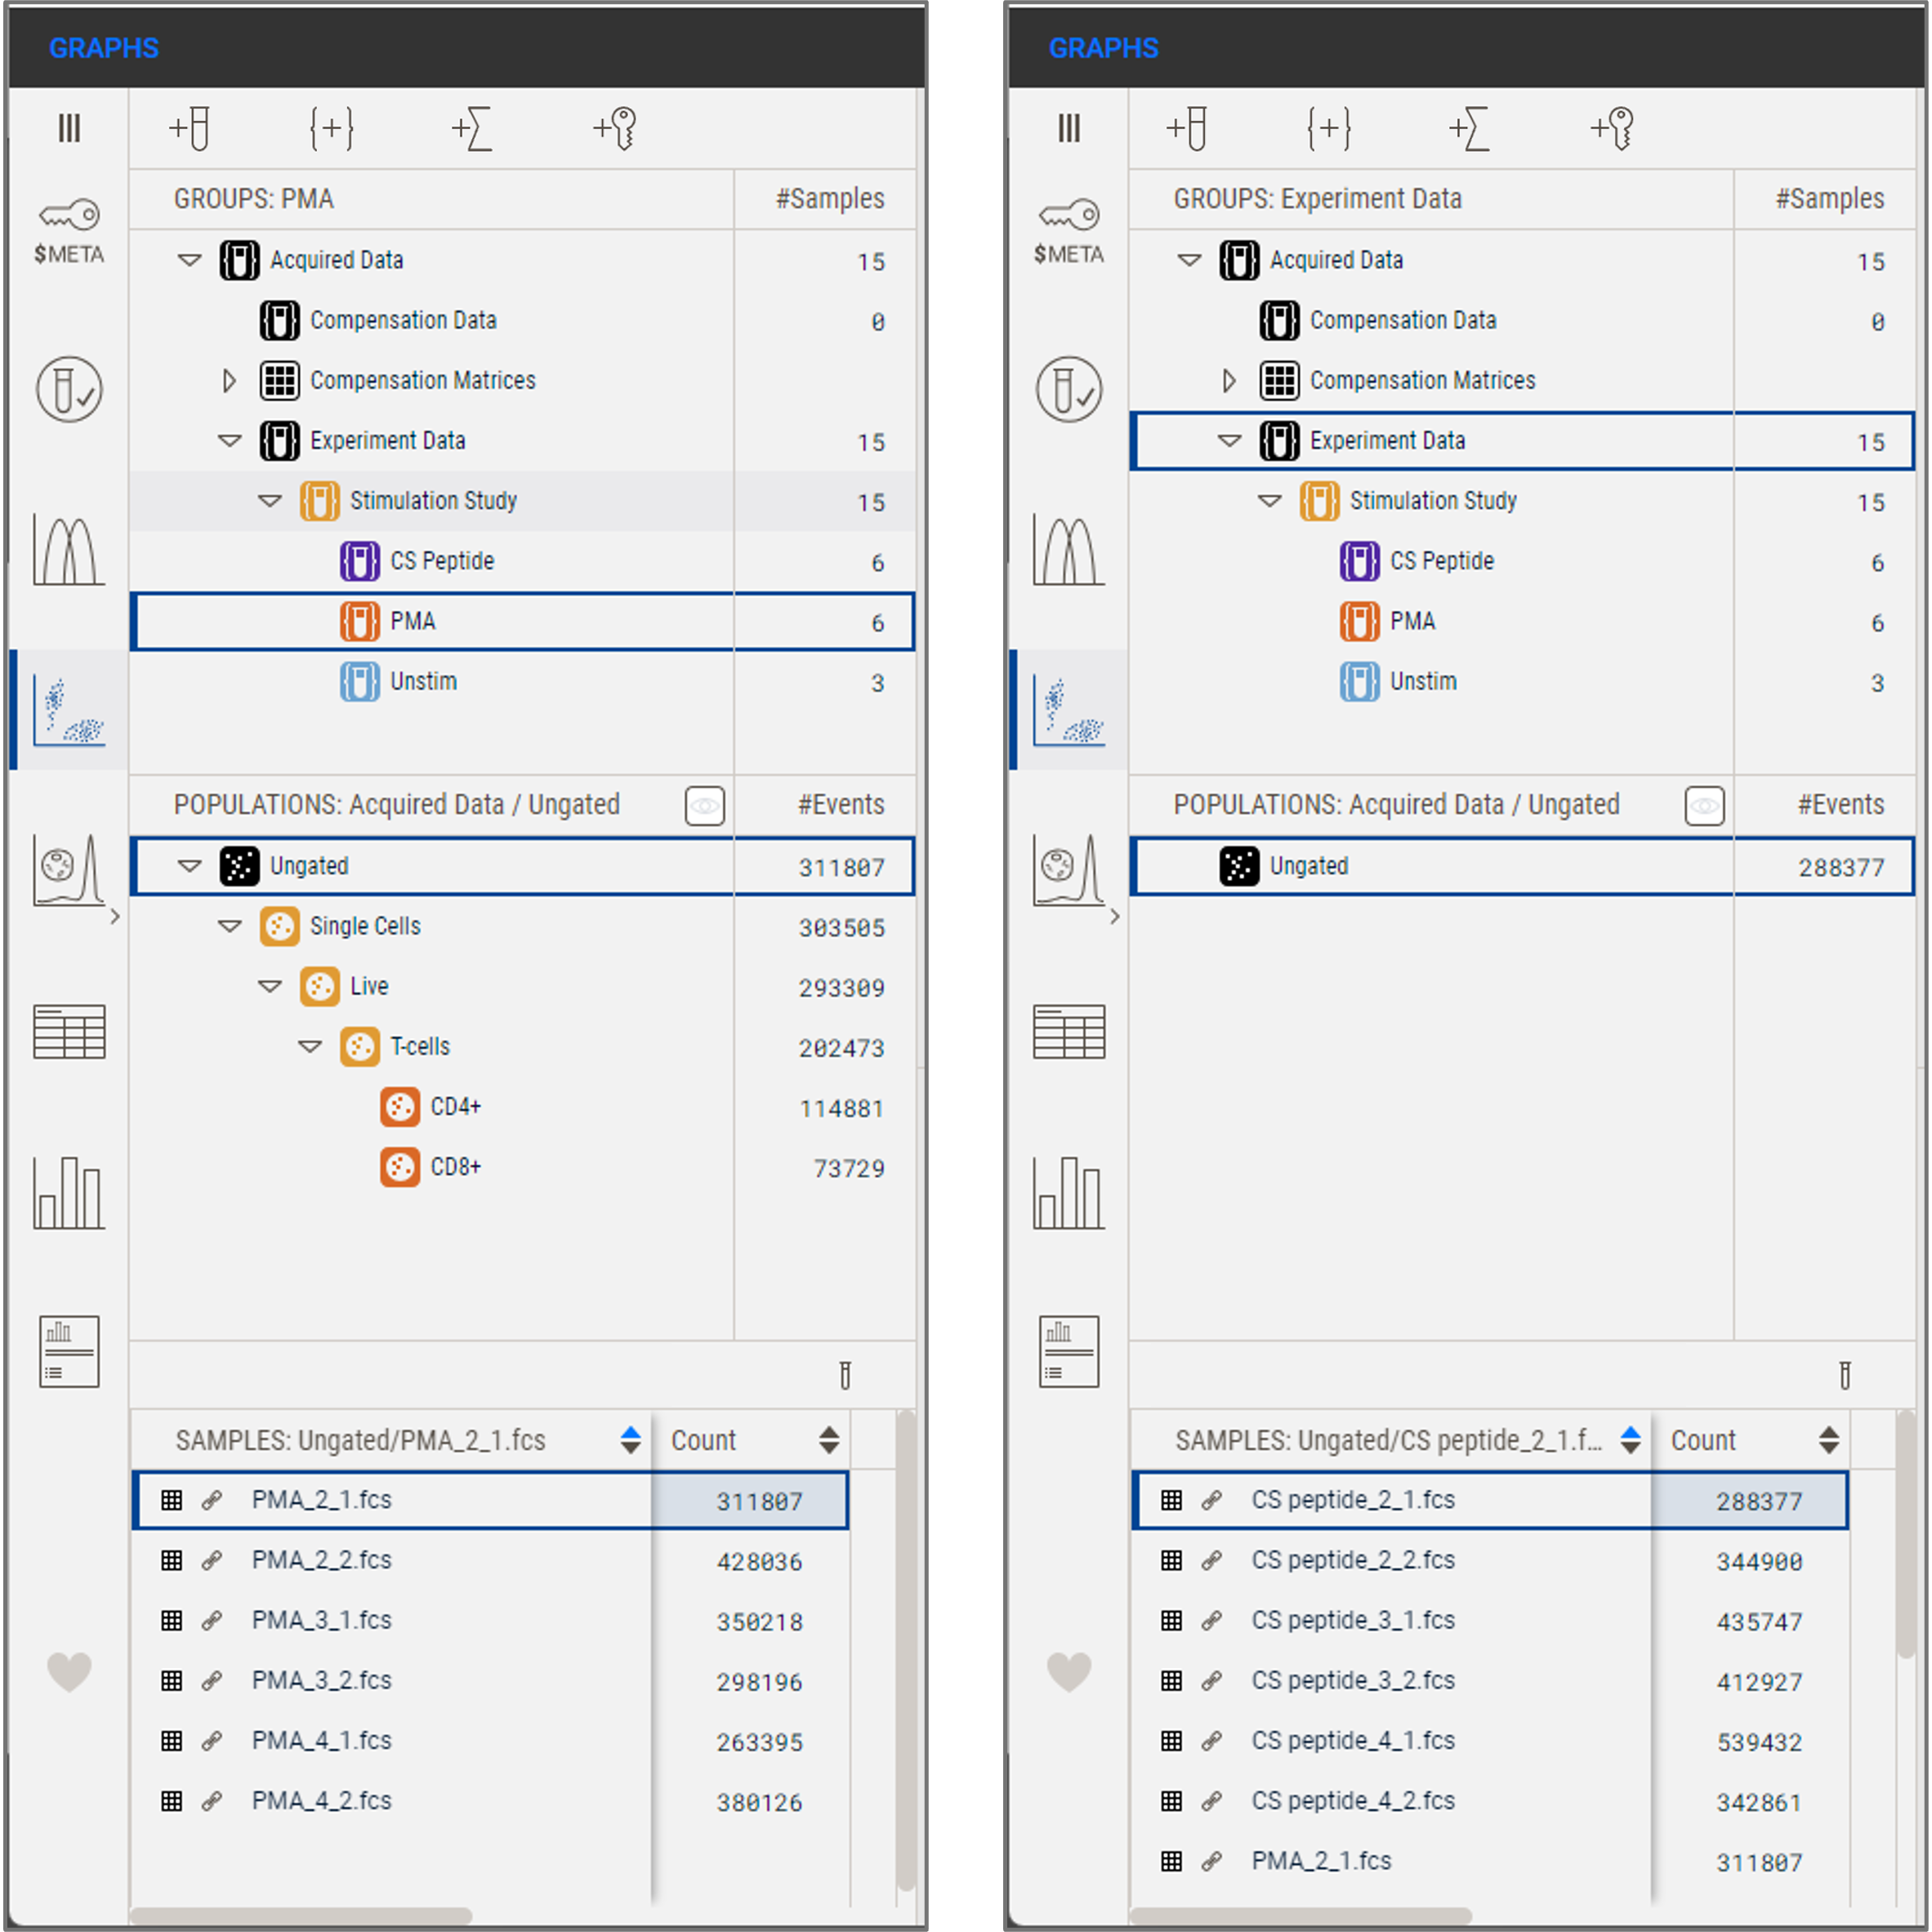
Groups work as filters. Selecting a group causes only populations and samples associated with the selected group to be displayed in the Sample and Population panels, respectively. In the example below, when the Experiment Data group is selected, the Populations panel shows only the Ungated cells, while the Samples panel shows a scrollable list that includes the 15 samples in the Experiment Data group (Figure 1b). When changing the selection to the PMA group, the populations present on the samples in the PMA group are visible in the Populations Panel, and only the 6 samples in the PMA group are visible in the Samples Panel at the bottom of the analysis hierarchy (Figure 1a).
(a) (b)
Figure 1. (a) Illustration of the Analysis Tree with the PMA group selected. (b) The same illustration but with the Experiment Data group selected.
Hierarchical groups
In FlowJoTM version 11, groups are now hierarchical. This means that a group can be sub-divided, and all child groups inherit any node present on the parent group. The group and population icons are color coded to indicate which group a population was created from. This approach facilitates comparison by allowing you to apply consistent analysis across many parts of an experiment, while maintaining the relationship between experimental files
In the example shown in Figure 1, the distribution of files is as such:
- Acquired Data: The repository for all samples added to a workbench
- Compensation Data: An ever-present child group of Acquired Data including every sample which contains the text string “Comp” or “Unstained” in the file name. Child groups of compensation are created automatically for every experiment brought into a workspace with comp controls, or manually by the user (see Creating Groups below)
- Experiment Data: Another ever-present child group of Acquired Data that contains every sample that is not placed in the Compensation group. In this example, no compensation controls are present so all samples in Acquisition data also appear in Experiment Data.
- Stimulation Study: A child group of Experiment Data that was created by the user dragging in a folder with the same name. There is just one set of experiment data in this workbench, so all files in Experiment Data are also in the group Stimulation Study.
- CS peptide: A child group of Stimulation Study that was created by the user dragging in sub-folders of data when Stimulation Study was added. Observe that this is the first division of data in this example as only 6 of the samples are part of this group
- PMA: Another child group of Stimulation Study, and a sibling group to CS peptide.
- Unstim: Another child group of Stimulation Study, and a sibling to both CS peptide and PMA.
- Stimulation Study: A child group of Experiment Data that was created by the user dragging in a folder with the same name. There is just one set of experiment data in this workbench, so all files in Experiment Data are also in the group Stimulation Study.
Creating groups
Groups can be created in three ways: by clicking the "Create Group" button {+}, by dragging in a folder of data, or by right clicking on an existing group and creating a child group (Figure 2).
Dragging and dropping a folder of data into a workbench creates a child group of Experiment Data with the same name as the folder. If there are compensation controls in this folder, another group with a name matching the folder will be added to the Compensation group. Any sub-folders associated with the dragged folder will generate child groups matching the structure of the dragged in folders. Data will be distributed to these groups as it is distributed within the folders.
Right-clicking on any group brings up a menu that allows you to create a new child group, or create a child group from Keyword or Staining Panel. There are also options to edit the definition of the selected group, rename it, or delete it as well as a series of copy or paste operations.
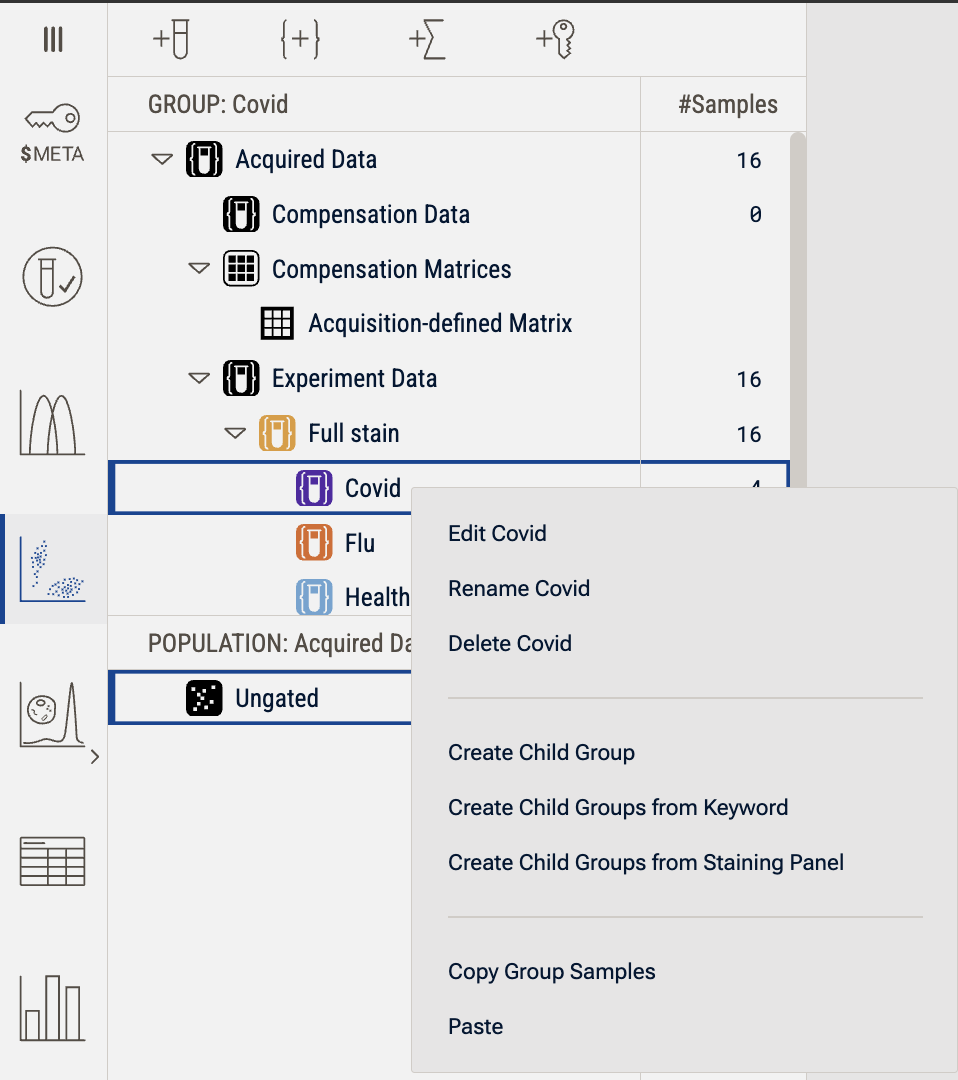
Figure 2. Illustration of the group operation context menu
Selecting the Create Child Group option opens the group creation dialog. A group must have a name. It may have criteria that automatically determine which samples are added to the group. Samples can always be dragged and dropped from the Samples panel into any group. In the example below, a new group with automatic selection criteria was created. The group has been given the name Stimulated. Three choices must be made to add a criterion: which keyword will be used, what the comparator will be, and what value will be tested for. In this example the keyword File Name was selected, the comparator is Contains, and the value PMA is being typed in. Once these three choices are made, click Add Criteria to include them in the group definition.
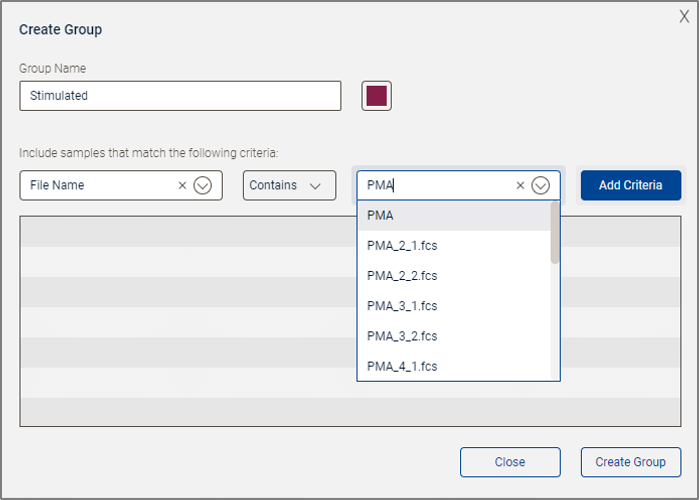
Figure 3. Group creation in progress
You can also add a second criterion (Figure 4). In this case File Name Contains CS peptide was entered. Notice that when multiple criteria are in use, a Boolean linker describing how they should be combined appears. In this example, Or has been selected. When all criteria have been entered, click Create Group to finish.
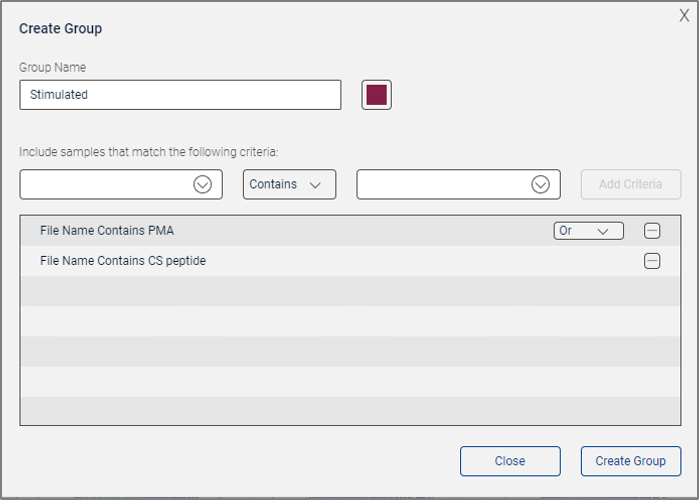
Figure 4. Group creation complete
A new group called "Stimulated" has been created, containing 12 samples that have either PMA Or CS Peptide in their name.
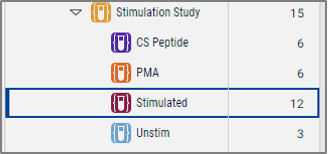
Figure 5. Resulting group
Sample management
There are several options for managing which samples are associated with which group:
- One or more samples can be selected in the Samples panel and dragged to any group. If the samples are already present in the group no further action will be performed.
- One or more samples can be selected from the Samples panel and deleted from a group by pressing the Delete key on your keyboard. These samples will remain in the workbench in every upstream group they are present in. If you delete them from the Acquired Data group, there is no upstream group, and the sample is thus removed from the workbench.
- A group can be dragged to another group. Any samples not already present in the target group will be added.
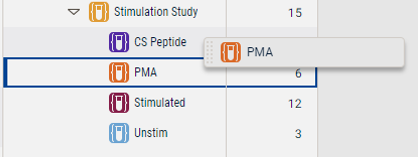
Figure 6. Samples from one group can be added to another group by dragging and dropping one group onto another.
See the Samples panel page for more information on sample handling.
Population management
Populations are always associated with groups and the color of the icon indicates which group. Any population created on a parent group is present on all samples in all child groups. It must be. Groups are just partitions, there is only one version of a sample in a workspace, so a gate drawn on a sample is always associated with that sample. Populations can be created on child groups that will not be associated with any sample in a parent group.
A population can be dragged and dropped to any group. This will be interpreted as either a copy or a move based on:
- A population can be copied to a sibling group, it cannot be moved to a sibling group.
- A population can be moved to an ancestor or descendant group; it cannot be copied to an ancestor or descendant group. Copying up or down the hierarchy is prevented to avoid accidentally duplicating populations since in a hierarchical group structure, the population will already be present on either all or some of the samples in the target. Essentially moving a population up or down the hierarchy is merely a change of ownership.
Move and copy options are accessed via either a right-click on the desired population, or via drag and drop.
See the Populations panel page for more information on operations around populations.
See the Gate Creation page for more information on creating populations.