
Tables are used to organize numerical data. They can be used to report on experimental outcomes or as the basis for Charts and Statistical models.
Tables are a flexible tool for selecting specific populations, statistics, and parameters for either exploration or reporting of results. Adding content to a table can be done via either drag and drop, or through the table properties panel. Once created, add your table directly to the Report, create a chart from it, or make a statistical model from it to test a hypothesis.
Overview
Select the Tables tool from the Navigation Bar (Figure 1). As the in-app instructions note, you can add data to a table by:
Drag one or more samples to add a row or multiple rows to the table.
Drag a group to add all the samples in that group as rows.
Drag one or more populations to the table to create columns that will be applied to any sample (row) for which the selected population exists.
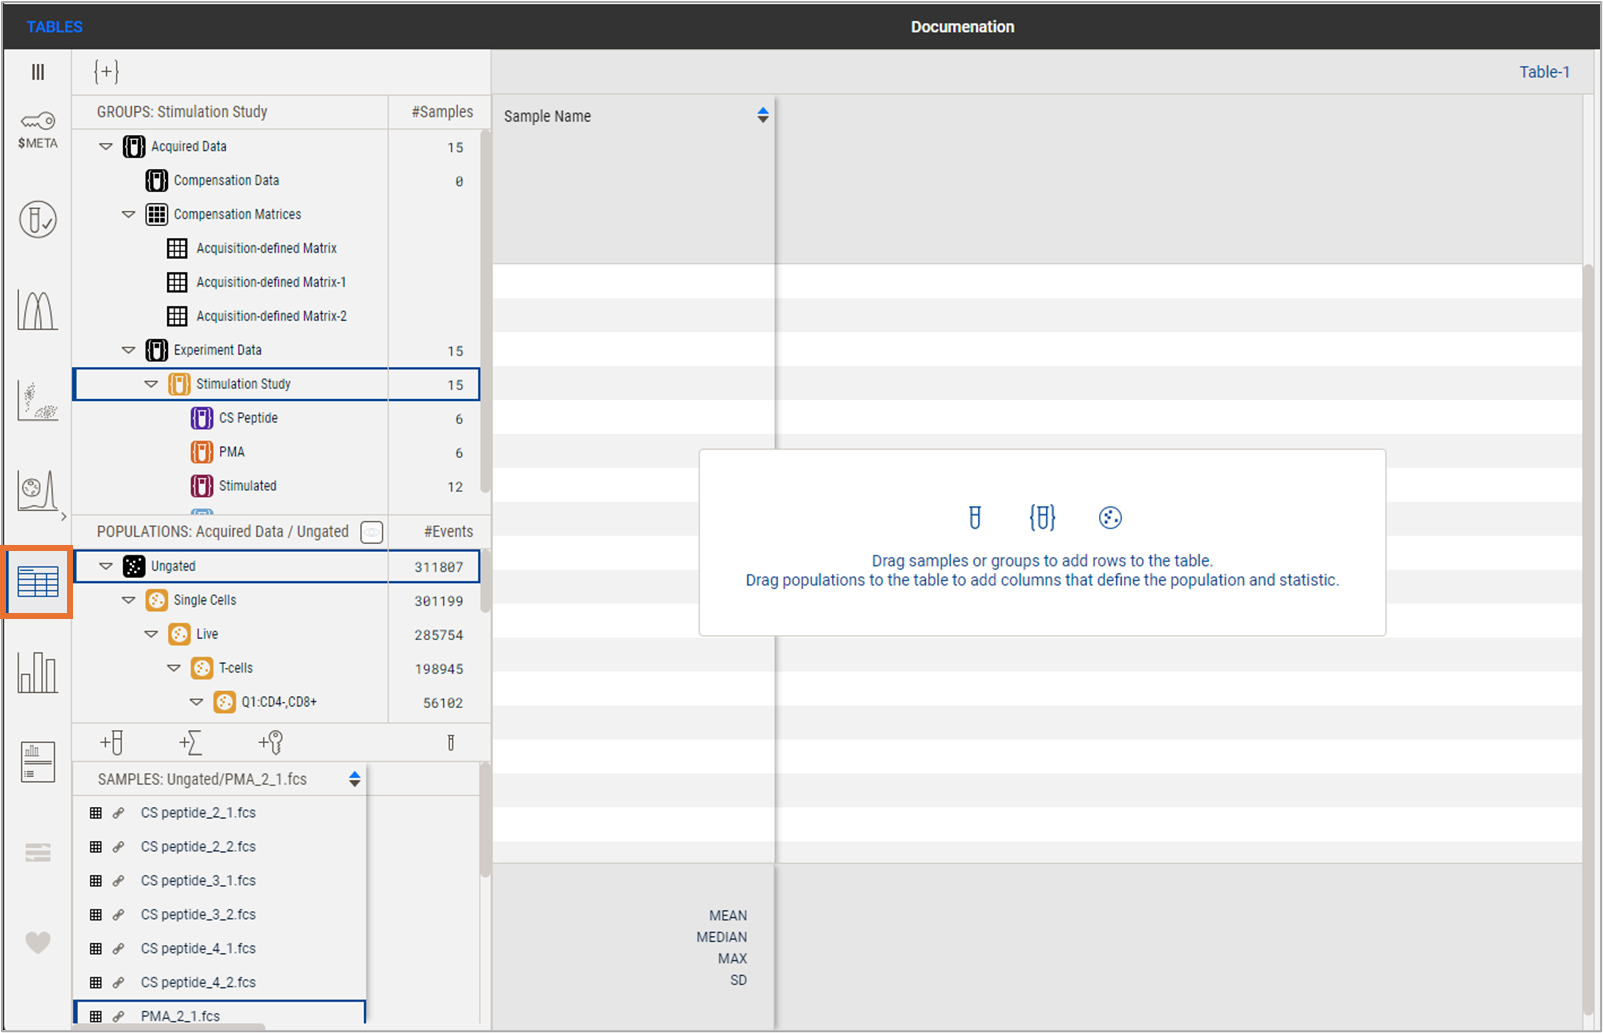
Figure 1. Creating a table
The default statistic is frequency of parent, but this can be adjusted via the Settings property in the Properties panel (Figure 2.1). The example below shows the result of dragging the Stimulation Study group in, causing 15 samples to be added as rows, and the IFN+ populations to be dragged in from both the CD4+ and CD8+ parent populations, causing the addition of two columns.
Unlike previous versions of FlowJoTM, no batching is needed to generate a table. Statistics are displayed while adding populations and samples, the table is live and will thus update immediately if additional information is added. Summary statistics chosen (Figure 2.2) are displayed immediately as well, and will also live update.
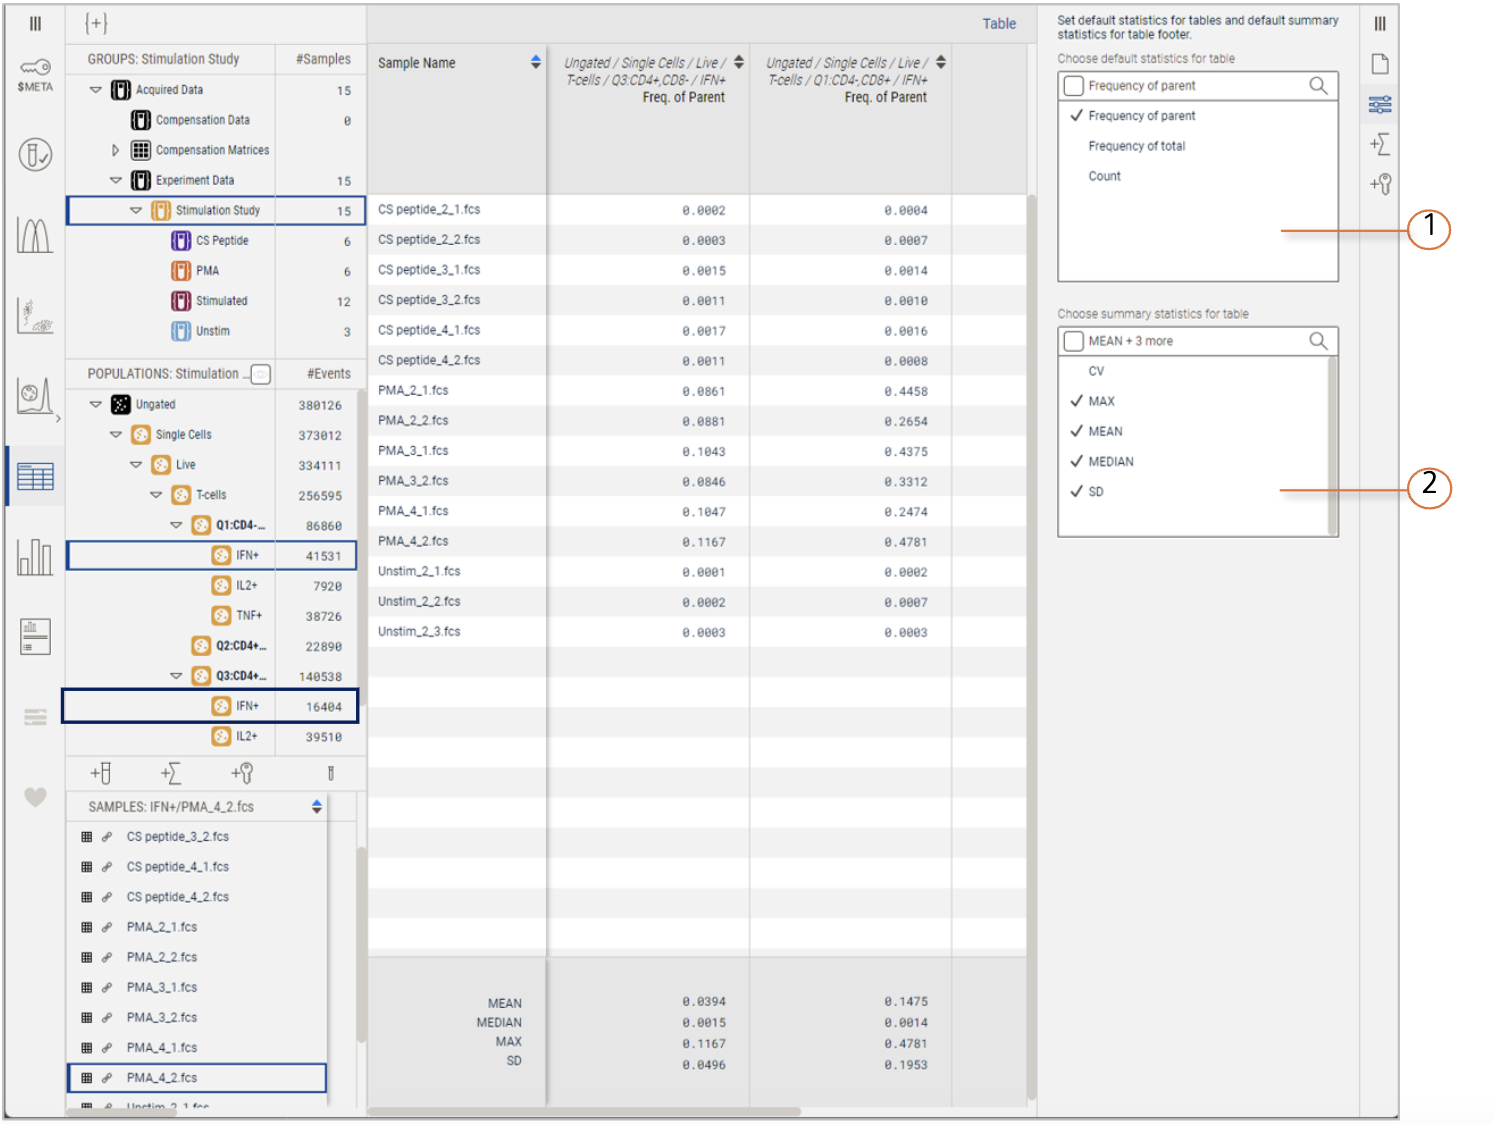
| No. | Description |
|---|---|
| 1 | Choose default statistics |
| 2 | Choose summary statistics |
Figure 2. Table Controls
Rows may be deleted by selecting one or more and pressing the Delete key (or backspace) on your keyboard. Columns may be deleted in the same manner, or by clicking the trash can icon that appears on hover over any column (Figure 3).
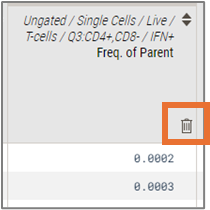
Figure 3. Delete column by icon on hover
Additional tools for building and modify tables are discussed in: