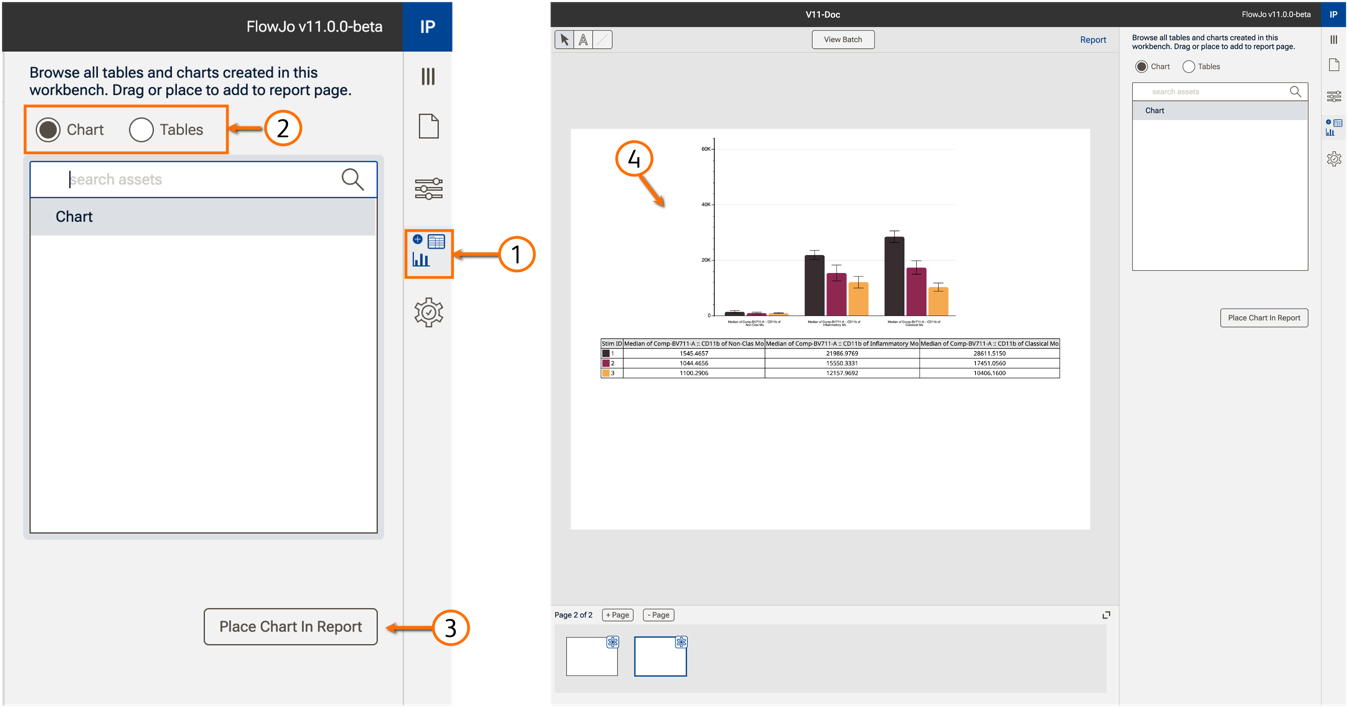
The report assets allow you to generate powerful reports by combining and inserting all information generated previously on the same workbench. By clicking on report assets (Figure 1.1) you can choose between your generated charts and tables (Figure 1.2) and place them on your current Source page (Fig 1.3).
This way you can create a complete report from all results of each experiment and export everything in a single document. Below is an example of how a chart is added to the report:

Figure 1. Report assets pane (left) and an example of copying the current available chart
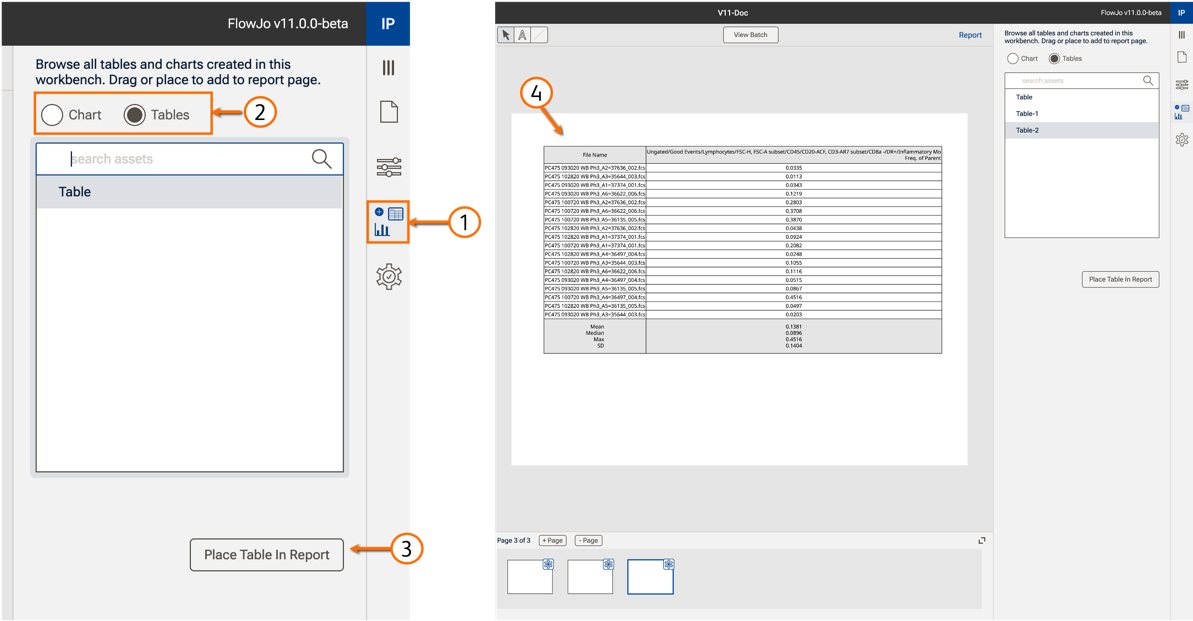
In a similar way, tables can also be transferred to a page of the reports (Figure 2) with their raw values and the ability to reformat those (Remove columns, change order etc) by right clicking on the element of interest.

Figure 2. Report assets pane (left) and an example of copying the current available table of statistics onto the report source page.
