
Uniform Manifold Approximation (UMAP)1 is an algorithm for performing dimensionality reduction, allowing visualization of complex multi-dimensional data in fewer dimensions while maintaining the structure of the data. UMAP computes two new derived parameters from a user defined selection of cytometric parameters. The UMAP-generated parameters are optimized in such a way that observations/data points which were close to one another in the high-dimensional data are close in the reduced data space.
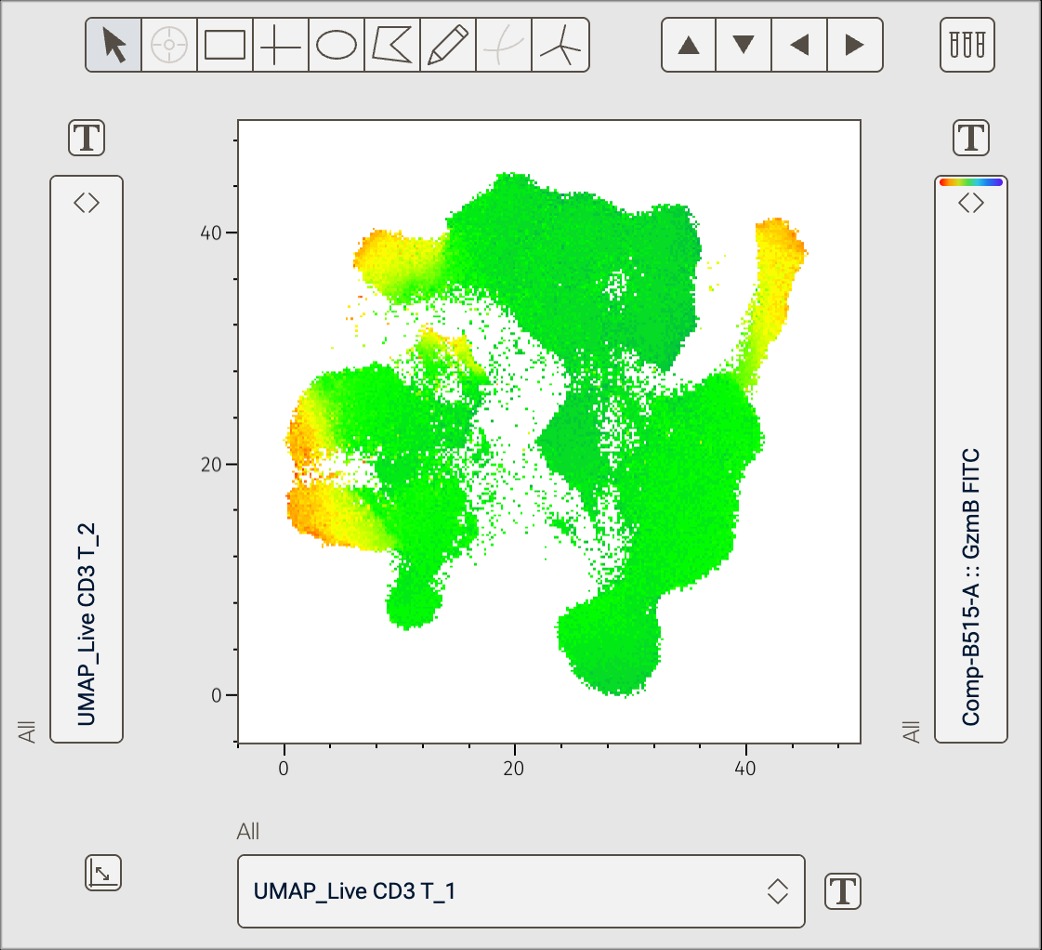
Figure 1. UMAP in v11
You can find the UMAP under the Platforms Context (Figure 2).
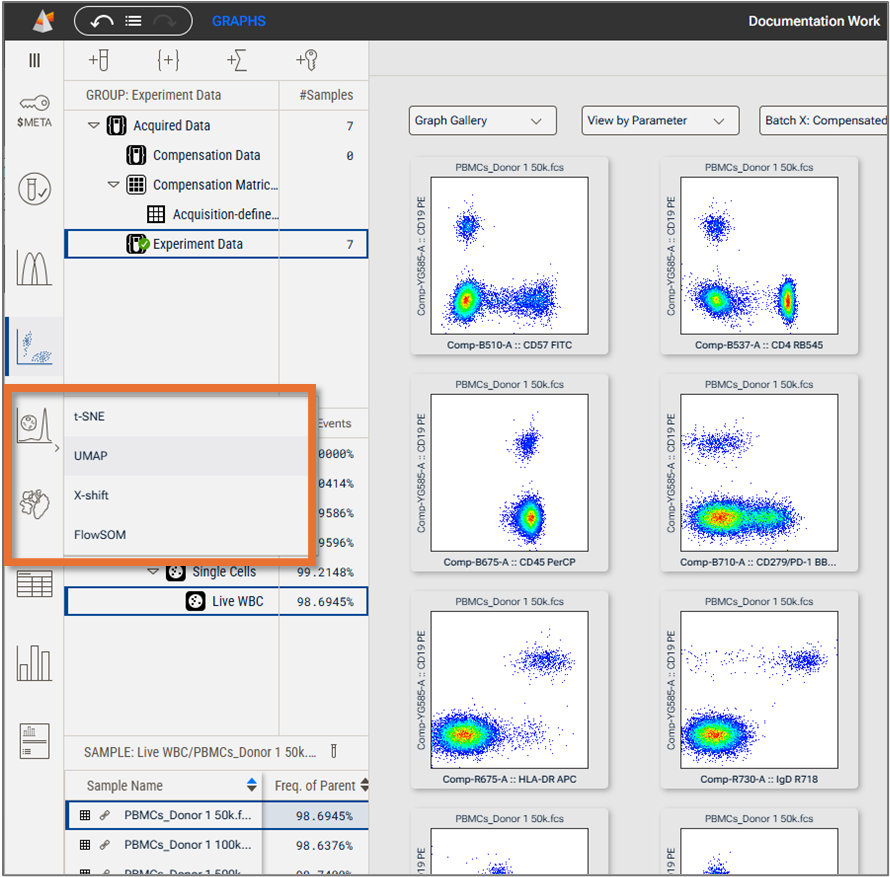
Figure 2. UMAP selection from the Platforms Context
Differences from tSNE
UMAP differs from tSNE in the initialization of the algorithm; UMAP begins the iterative process of arranging the cells in low dimensional space with the data spaced apart relative to their distance in high-dimensional space. tSNE initializes randomly. This allows the UMAP result to represent the overall or global structure of the data more effectively by locating similar cells consistently near each other, and the distance between populations is representative of the distance in the high-dimensional data. tSNE will separate dissimilar cells in small regions allowing you to see the local structure of the data more distinctly at the cost of loosing the overall relationship between populations.
How to run UMAP in v11
- Select parameters: After the platform panel is displayed (Figure 3), select which parameters will be used. Choosing a parameter set (Figure 3.1) will help you filter them quickly. If your data is fluorescence-based, make sure to choose only compensated parameters.
Adjust settings (optional). Defaults have been provided as a starting point and should be acceptable for many data sets.
Minimum distance is a purely aesthetic control that determines how tightly packed the events will be. A larger number represents more spread out data (Figure 3.2).
Number of neighbors controls how many events will be considered the 'neighbors' (most similar cells) of each point. The larger the number, the more global the representation of the data the plot will be at the cost of nuance between smaller groups of cells (Figure 3.3).
Distance metric is the way similarity or distance between two cells is calculated. The choices are Euclidean or Manhattan. Euclidean is familiar to most people. It is the square root of the sum of the squared distances in all dimensions. Manhattan distance is the sum of the magnitude of difference between all parameters. Manhattan distance becomes useful as the number of dimensions you have goes up, as it negates the impact of outliers more than Euclidean by not squaring the distances (Figure 3.4).
Number of components is how many UMAP parameters will be created. Two can be visualized easily, three with a heatmap overlaid. More than that means that you will need multiple plots to see all of the parameters (Figure 3.5).
Choose a downsampling method: None, Random or Uniform (more information about downsampling is listed below). Total number of events: the range is from 2 to 10000000 (Figure 3.6). NOTE: Based on the number of events selected in the downsampling option, a preview of the percentage of events used to run the algorithm will be shown. This percentage is relative to the total number of cells included in the selected population. UMAP will automatically run on the Virtually Concatenated Population, meaning it will use all of the samples in the selected group for the selected population to create a population-wide result (Figure 3.6).
Initiate the calculation by clicking Submit (Figure 3.7). The algorithm will run on the input population selected, using the provided options.
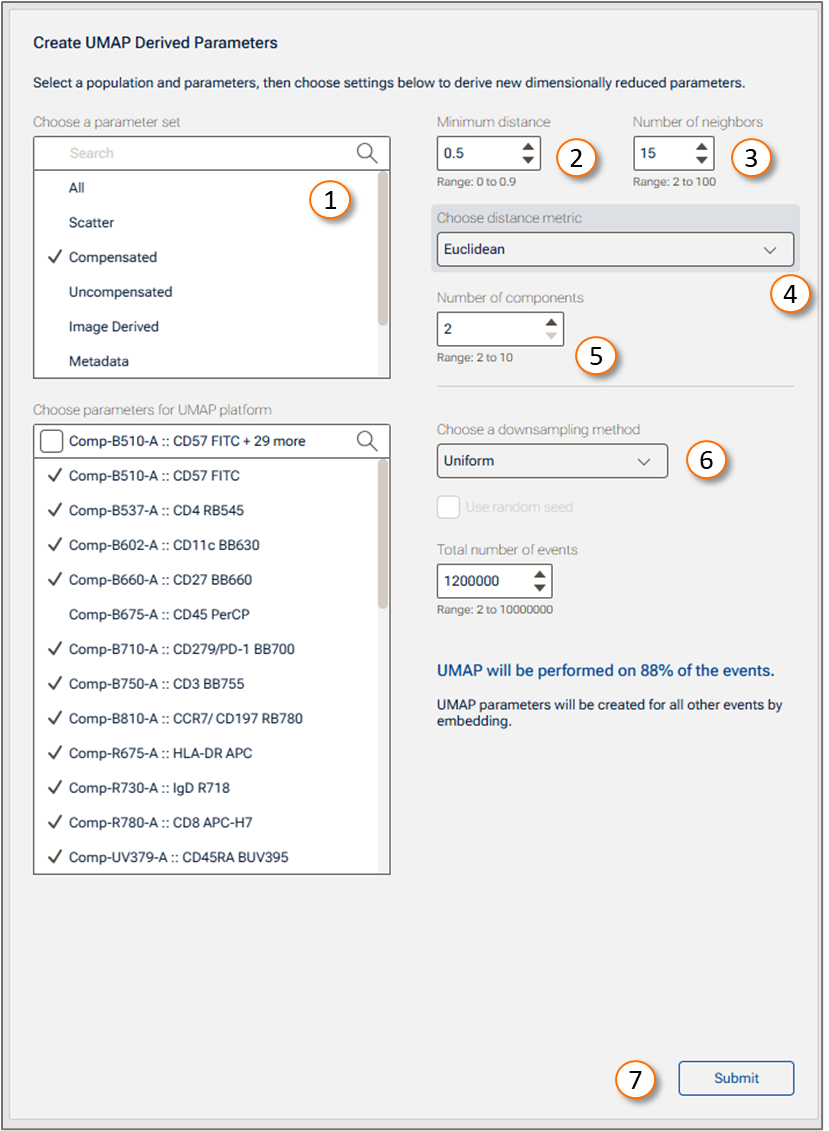
Figure 3 UMAP platform
| No. | Element |
|---|---|
| 1 | Parameter set selector |
| 2 | Minimum distance setting |
| 3 | Number of neighbors setting |
| 4 | Distance metric control |
| 5 | Number of components |
| 6 | Downsampling method |
| 7 | Submit button |
McInnes, Healy. UMAP: Uniform Manifold Approximation and Projection for Dimension Reduction. Feb 2018. arXiv:1802.03426