
FlowSOM1 is a two-stage clustering algorithm that first uses a Self-Organizing Map (SOM) to learn the structure of the data, then a K-means clustering algorithm to divide that structure up into distinct populations.
Overview
FlowSOM is available from Platforms as shown in Figure 1. When selected, the platform options, Figure 2, will be shown in the Discovery Panel. Proceed with selecting the parameters to use for unsupervised clustering, the dimensions of the SOM, and the final number of clusters to output. Once the clustering algorithm finishes calculating it will produce sibling populations as children of the population selected for clustering. These outputs can then be used to further analyze and interrogate the primary population of interest.
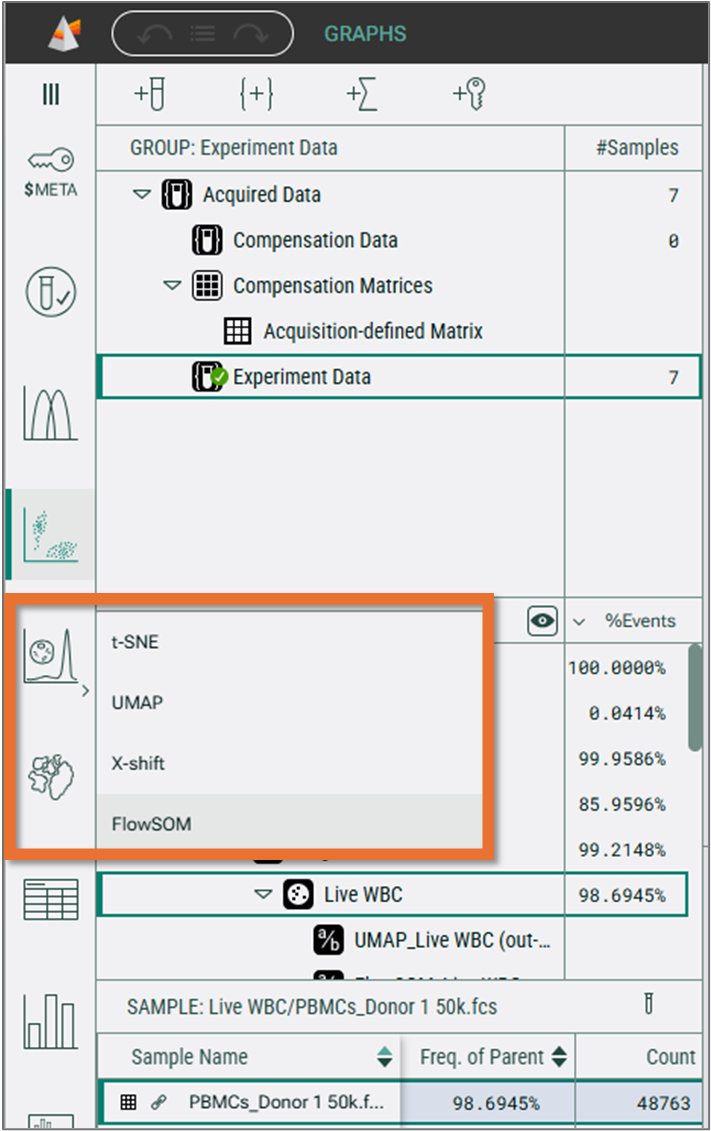
Figure 1. FlowSOM selection from Platforms Context
How to run FlowSOM in FlowJo v11
Select which parameters will be used once the algorithm setting window appears (Figure 2). You can filter the parameters by choosing a parameter set (Figure 2.1). If your data is fluorescence-based, make sure to choose only compensated parameters (denoted by the Comp- prefix).
Adjust settings (optional). Defaults have been provided as a starting point and should be acceptable for many data sets. Your options are:
Distance metric: Euclidean, Manhattan, Chebyshev, or Cosine. The default is Euclidean (Figure 2.2).
X and Y dimensions. Step 1 is to build a map of the raw data by conforming a grid of size X by Y to the raw data. Each intersection of grid lines is a node that can be modified to fit the data. Nodes are effectively center points of clusters. A grid of X=10 and Y=10 (the defaults) would have 100 nodes, creating 100 populations to start the analysis (Figure 2.3).
Number of Meta-clusters. Once the SOM is fit to the data, the nodes are clustered again, or meta- clustered, by running a K-means algorithm on the nodes to reduce the amount to however many clusters you specify. This implies that X * Y grid nodes should produce a substantially larger number than the number of meta clusters so the algorithm has the flexibility to merge similar nodes while leaving dissimilar nodes separate. By default, 10 meta-clusters are used for a 100 node SOM (Figure 2.4). NOTE: you can estimate the number of meta-clusters by making a UMAP or tSNE first and roughly counting the number of populations you see by eye, and perhaps adding a few to that as a safety factor.
Choose a downsampling method (optional): Downsampling reduces the number of events by choosing cells throughout the selected parent population. There are two available methods to reduce the number of events, Uniform or Random (Figure 2.5). Uniform will select events regularly across the data set (usually ordered by time of collection). Random will do what the name implies. The Total number of events specifies how many events will be used with a range of 2 to 10,000,000. NOTE: FlowSOM will automatically run on the Virtually Concatenated Population of whatever you have selected, so that you can compare data across samples. The percentage of events displayed in the window is the number after downsampling, divided by the concatenated population. More events will take longer to run, but give you a better model of the data.
Initiate the calculation by clicking Submit. The algorithm will run on the input population selected, using the defined options.
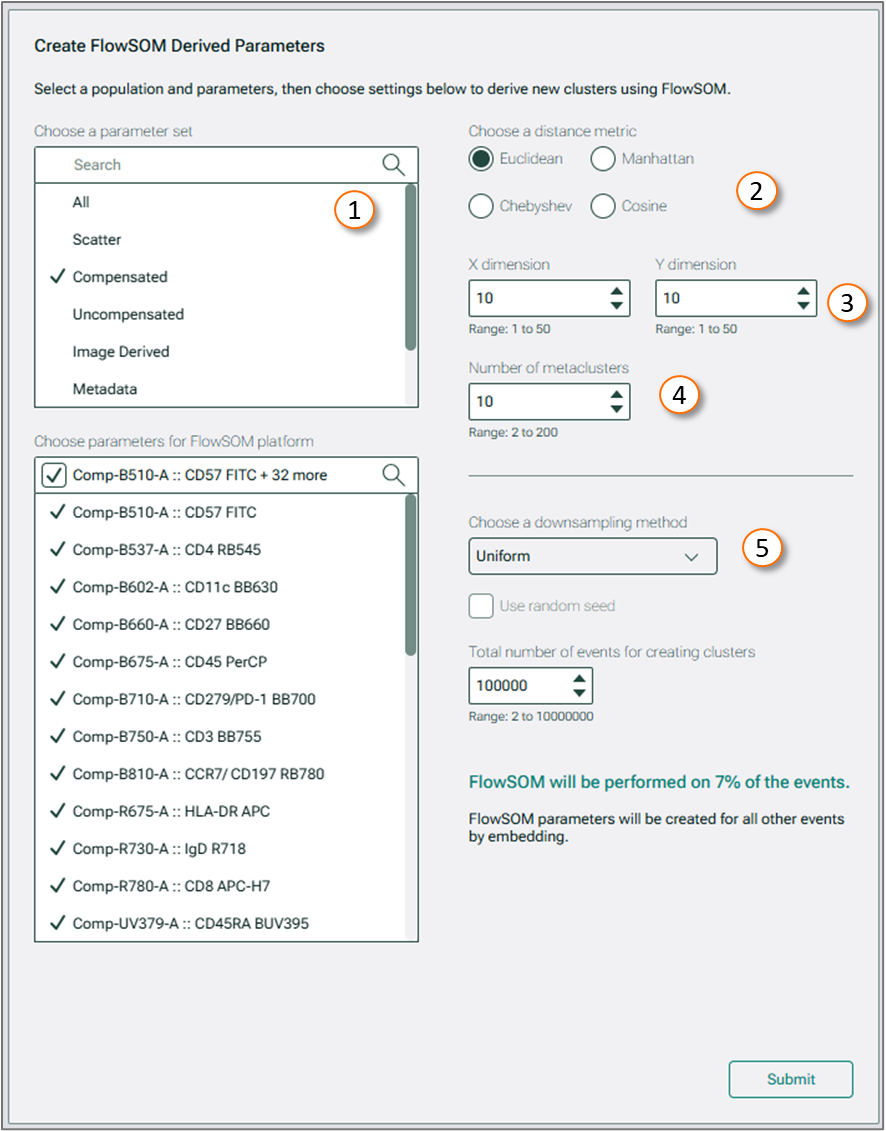
Figure 2. FlowSOM Platform Panel
No. | Description |
|---|---|
1 | Parameter Selection |
2 | Distance Metrics |
3 | SOM size |
4 | Output Clusters |
5 | Downsampling Controls |
Output
The algorithm will created a derived parameter called FlowSOM (Figure 3), assign each cell a value that corresponds to which cluster the cell belongs in, then autogate on the derived parameter. A plot will then be rendered showing the range gates applied to this parameter (Figure 4).
The range gates will create clusters as new populations in the Populations panel.
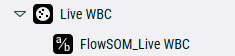
Figure 3. FlowSOM derived parameter
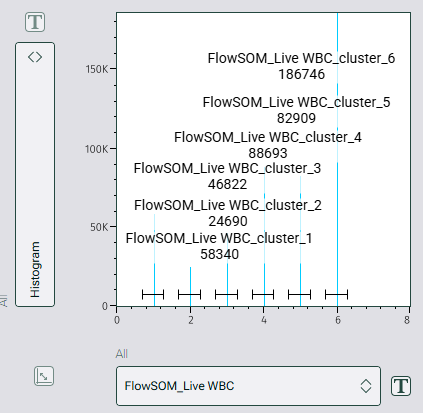
Figure 4. Range gates used to create clusters as populations in FlowJo
Importantly, the clusters that are created as outputs from FlowSOM are just populations in FlowJo. You can use any tool in FlowJo on them including the Cluster Explorer, overlays in Reports, Tables, Charts, and further gates.
Additionally, you can click on the FlowSOM derived parameter at any point to open a graph with the range gates on it, or drag it into Reports to add that same plot to a report.