
T-Distributed Stochastic Neighbor Embedding (t-SNE) is an algorithm for performing dimensionality reduction, allowing visualization of complex multi-dimensional data in fewer dimensions while still maintaining the structure of the data. t-SNE is an unsupervised nonlinear dimensionality reduction algorithm useful for visualizing high dimensional flow or mass cytometry data sets in a dimension-reduced data space. The t-SNE platform computes two new derived parameters from a user defined selection of cytometric parameters. The t-SNE-generated parameters are optimized in such a way that observations/data points which were close to one another in the raw high dimensional data are close in the reduced data space. Importantly, t-SNE can be used as a piece of many different workflows. It can be used independently to visualize an entire data file in an exploratory manner, as a preprocessing step in anticipation of clustering, or in other related workflows.
You can find the t-SNE Platform with all the improvements from opt-SNE1, available under the Platform Context. The Platform options will be displayed in the Discovery panel (Figure 1).
How to run t-SNE in v11
- After the platform panel is displayed, (Figure 1) select which parameters will be used for the t-SNE calculation. Choosing a parameter set will help you filter them quickly (Figure 1.1) . If your data is fluorescence-based, make sure to choose only compensated parameters (denoted by the Comp- prefix) (Figure 1.2).
Adjust settings (optional). Defaults have been provided as a starting point and should be acceptable for many data sets. The Opt-SNE algorithm (1), is highly recommended (and selected by default), as it is based on automated Learning Configurations (Figure 1.3) . This option will use the value in the Iterations setting as a maximum value, and halt the operation when the algorithm stops improving, saving you time. For more information about Opt-SNE check the original publication here.
Choose a downsampling method: None, Random or Uniform (more information about downsampling is listed below ) and the Total number of events: the range is from 2 to 10000000 (Figure 1.4). NOTE: Based on the number of events selected in the downsampling option, a preview of the percentage of events used to run the algorithm will be shown. This percentage is relative to the total number of cells included in the selected population. T-SNE will automatically run on the Virtually Concatenated Population, meaning it will use all of the samples in the selected group for the selected population to create a population wide result.
Initiate the calculation by clicking Submit (Figure 1.5). The algorithm will run on the input population selected, using the provided options. The platform will create two new parameters, which are the dimension-reduced outputs from the algorithm.
Technical options
KNN algorithm – Sets the k nearest neighbors algorithm. One of the initial steps in t-SNE is to calculate the ‘distance’ or similarity between pairs of cells, using the intensity values of all selected parameters. There are two options to calculate such distance: a vantage point tree which is an Exact method that calculates all distances between all cells and compares them to a threshold to see if they are neighbors and the ANNOY algorithm. This Approximation (random projection forest –ANNOY) relies on not necessarily needing all the nearest neighbors to significantly speed up the calculation.
Iterations – Maximum number of iterations the algorithm will run. Values between 300-3000 are recommended. When selecting the “manual” option, decreasing the number of iterations will speed up the calculation time, but could negatively impact the final embedding resolution.
Perplexity – Perplexity is related to the number of nearest neighbors that is used in learning algorithms. In t-SNE, the perplexity may be viewed as the number of effective nearest neighbors. The most appropriate value depends on the density of your data. Generally, a larger / denser dataset requires a larger perplexity. Values between 10-100 are recommended.
Learning Rate – The learning rate, which controls how much the weights are adjusted at each update. In t-SNE, it is a step size of gradient descent update to get minimum probability difference. It can also be described as how rapidly the algorithm learns to position data points in the low dimensional space. A value of 1-10000000 can be specified. Optimally set at 7% the number of cells being mapped into t-SNE space.
Downsampling method: Downsampling reduces the number of events choosing cells throughout the selected parent population. There are two available methods to reduce the number of events taken in account for the calculation. Uniform or random will either take events regularly across the order of events (usually ordered by time of collection), or randomly.
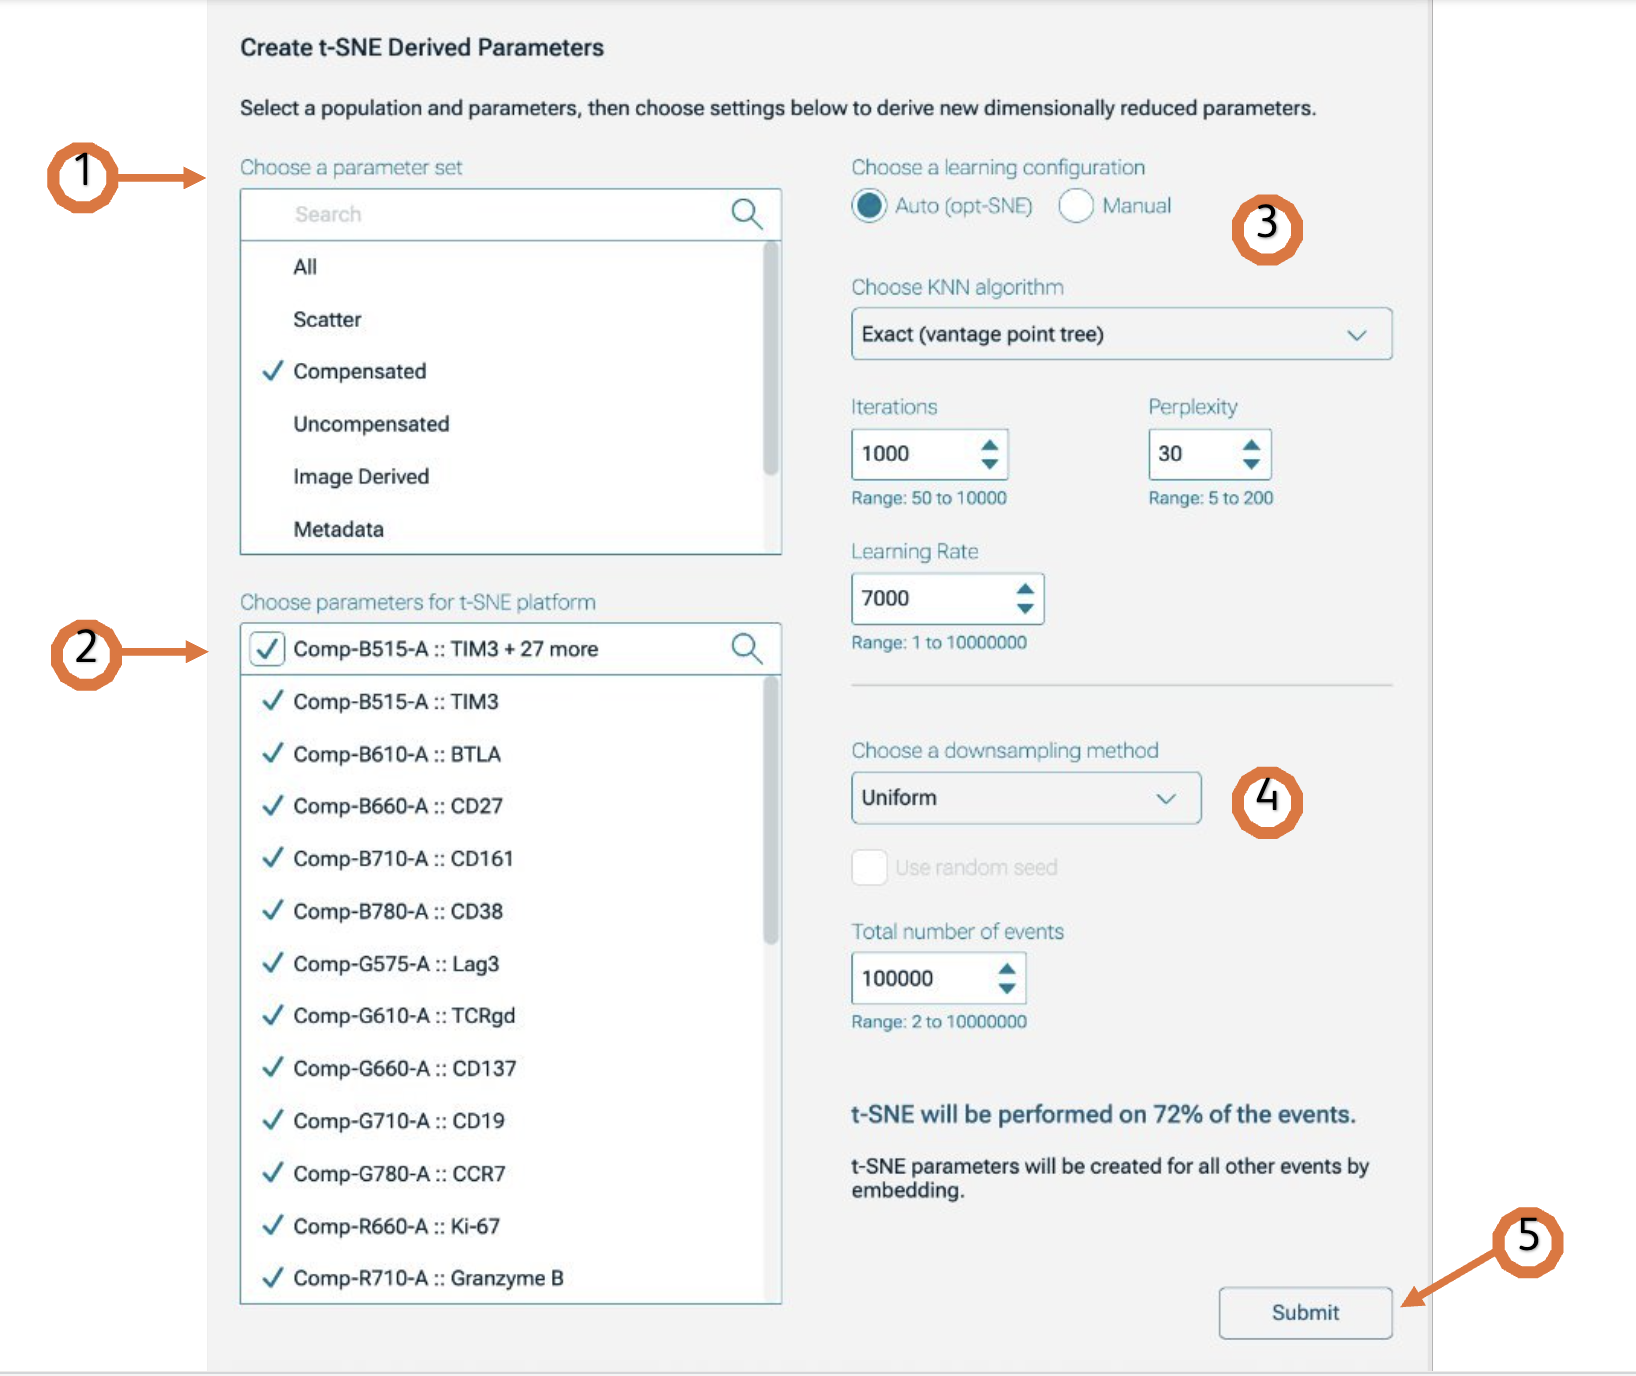
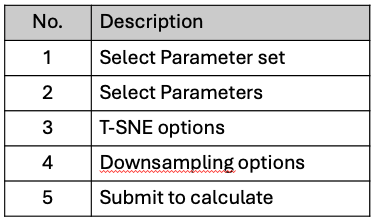
Figure 1. t-SNE platform
Belkina, A.C., Ciccolella, C.O., Anno, R. et al. Automated optimized parameters for T-distributed stochastic neighbor embedding improve visualization and analysis of large datasets. Nat Commun 10, 5415 (2019).