
Visually explore image data captured and exported from the BD FACSDiscover™ Platforms.
FlowJoTM Software allows interactive exploration of FCS files and associated image files collected using the BD FACSChorus™ acquisition software. In FlowJoTM v10, this is possible through the BD CellView™ Lens plugin. FlowJoTM v11, however, has built-in support for image files through the Image Wall in the Graphs Context (Figure 1).
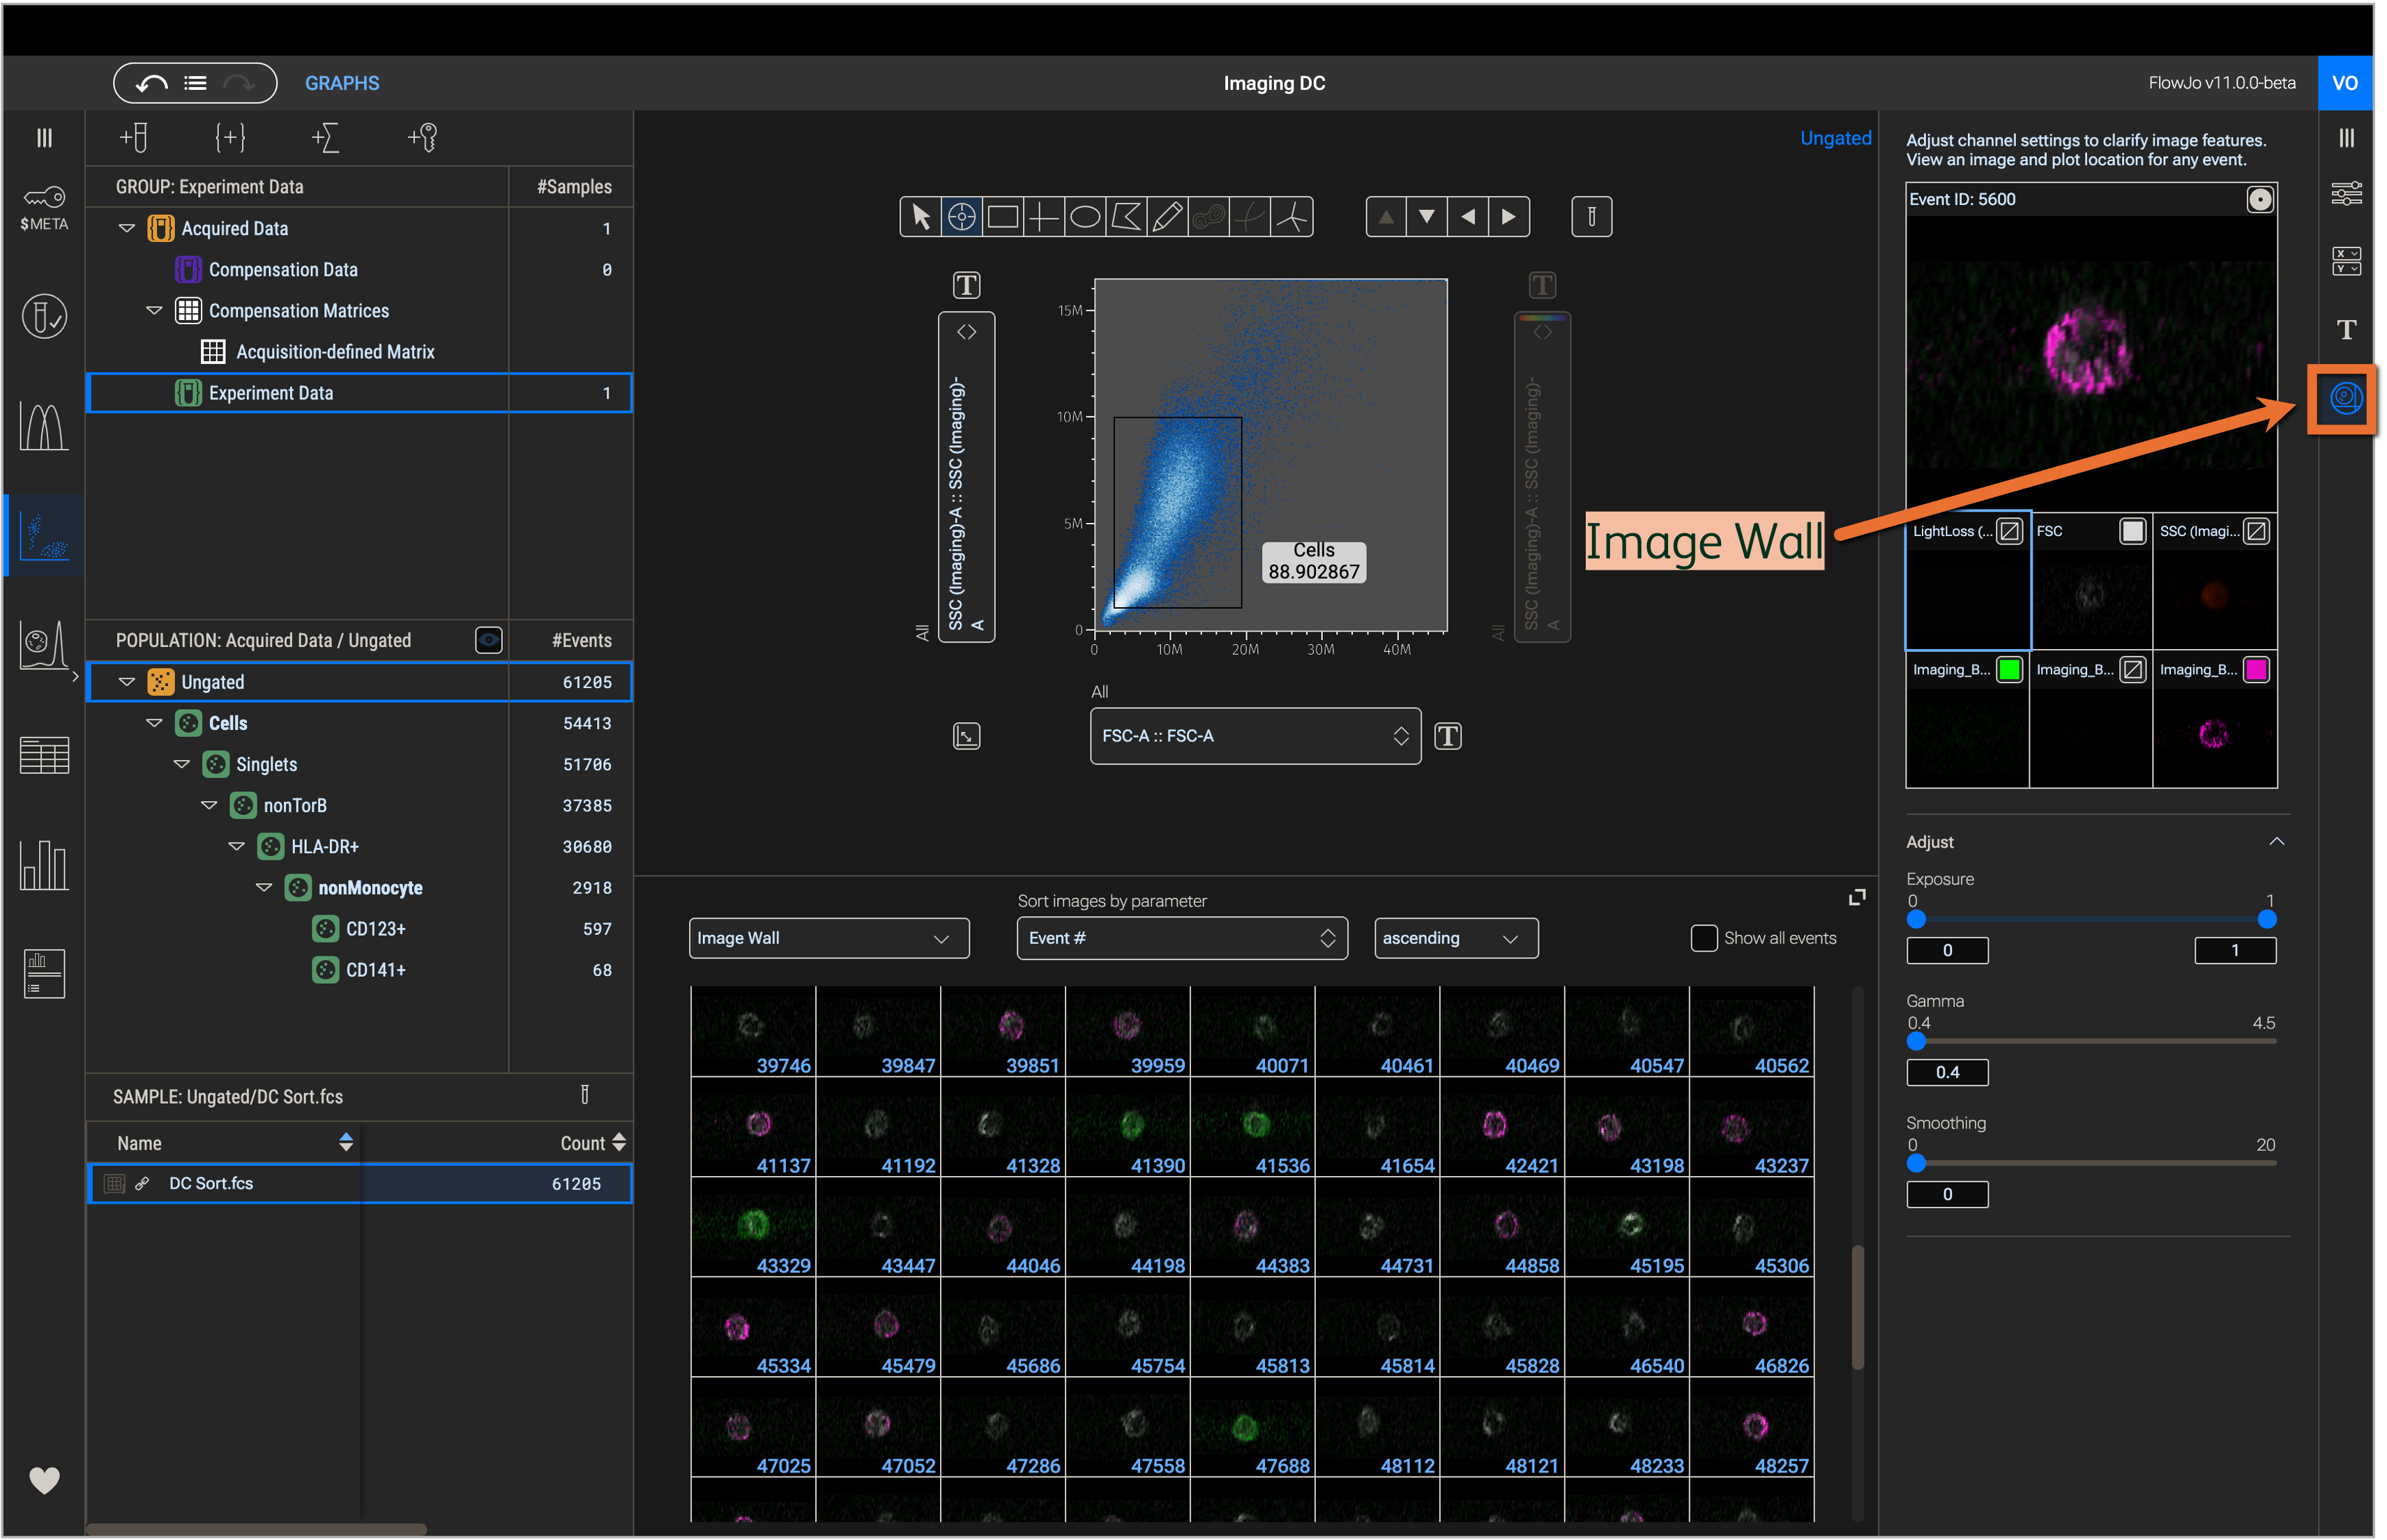
Figure 1. Image wall in the Graphs context
Obtain images files
In addition to FCS files, BD FACSChorus™ exports BD CellView™ wave (CVW) files which contain the images associated with specific cells, but in a compressed format. For analysis, the images must be extracted as TIFFs from the compressed CVW file. This can be done using the BD CellView™ Image Extractor program. Alternatively, load FCS files into FlowJo v10.10+ and use the BD CellView Lens plugin v2.0.15+; this version of the plugin has TIFF extraction from CVW files built in.
With either extraction approach, the image files will typically be organized into numerical subfolders (e.g. ‘00000000’, ‘00010000’, etc) where 10,000 images files are in each subfolder (Figure 2). Do no disrupt this folder structure or images may fail to load. Keep extracted TIFFs alongside accompanying FCS files in the same parent folder (Figure 2) and try to work locally on your device during your analysis (avoid network or cloud storage).

Figure 2. Typical folder structure after extracting TIFFs from CVW
Display images
Load FCS files into the workbench using the Add Samples button or by drag-and-drop from your computer’s file explorer; CVW or TIFF files do not need to be added and will not load in FlowJoTM v11 automatically. Navigate to the Graphs Context and select Image Wall in the Properties panel (Figure 3). Display images in Graph gallery by selecting Image Wall in the dropdown menu. Sort images by a selected parameter using the respective dropdown menus. Click an image in the Image Wall to see it in the display of the Properties panel.
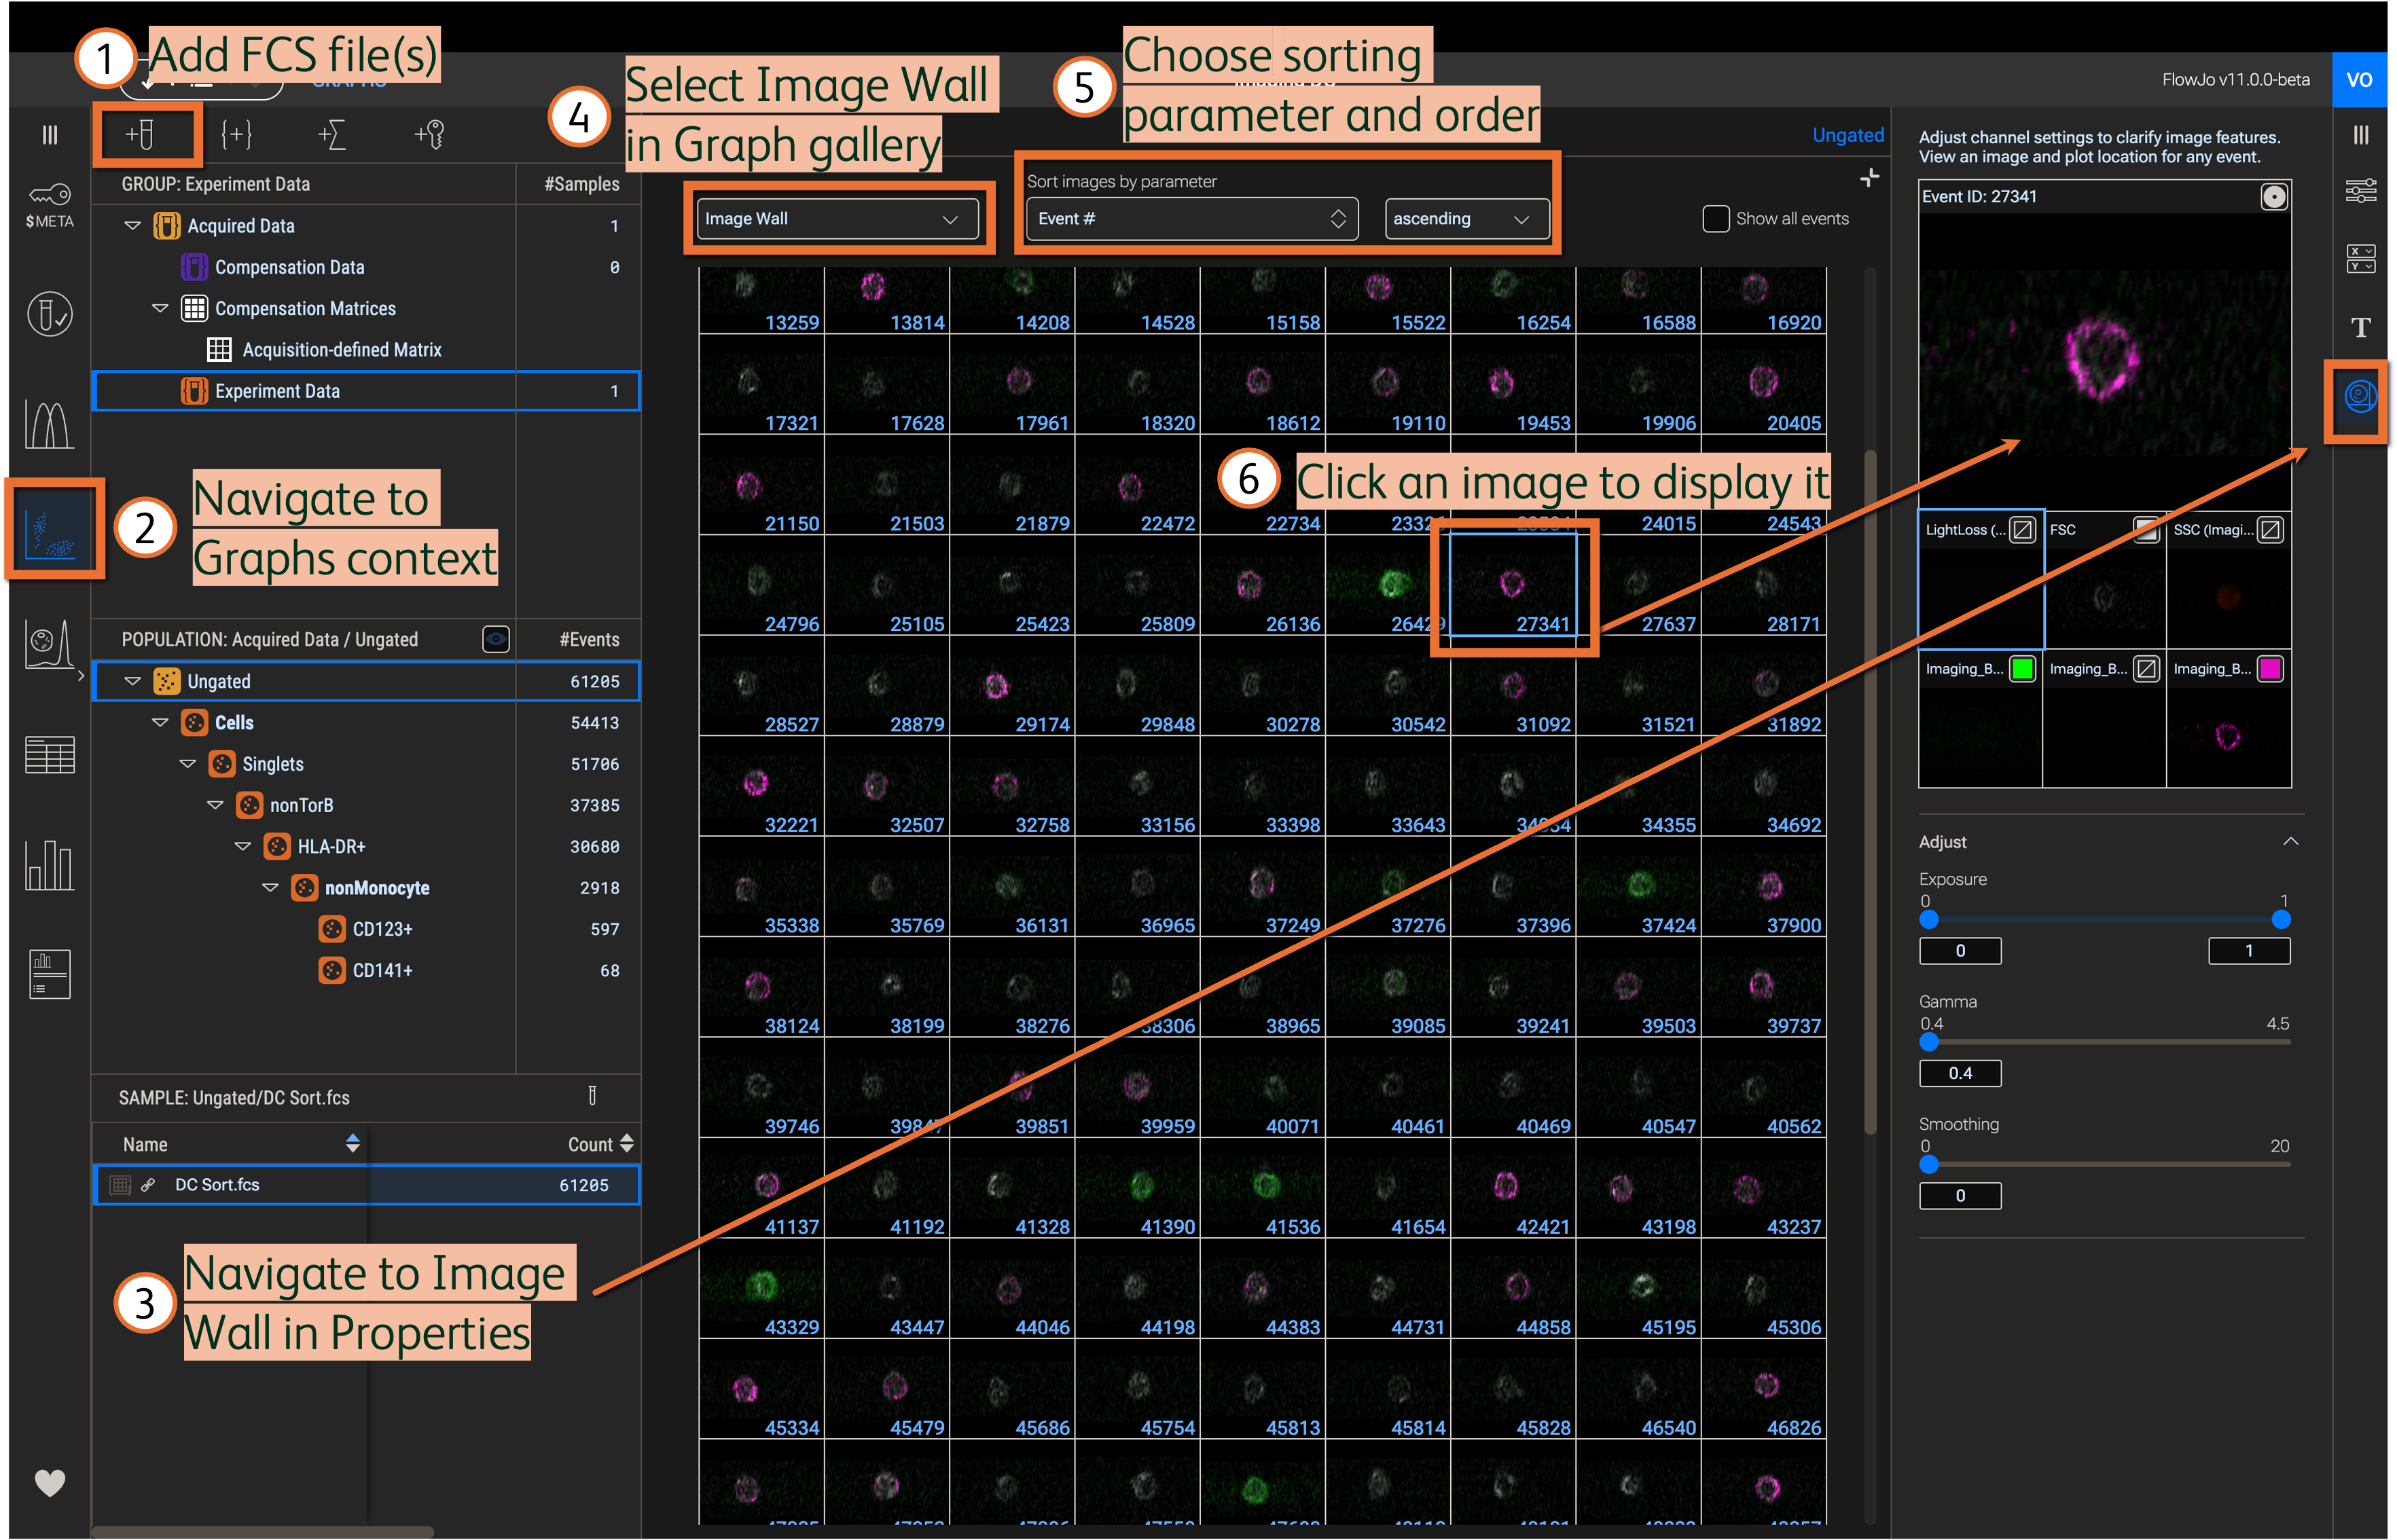
Figure 3. Display and sort images in the Image wall
Adjust image channel settings
Click an image from the Image Wall to display it in the Properties panel. The images in the Image Wall and in the display of the Properties panel will show all enabled channels as an overlay. Hide channels from the overlay by clicking the corner box inside each single channel and selecting the crossed-out box; show channels by selecting the filled colored box (Figure 4). Click the colored box a second time to change the color of a channel. Click a color in the color picker or input a HEX value and the selected color will apply to the channel.
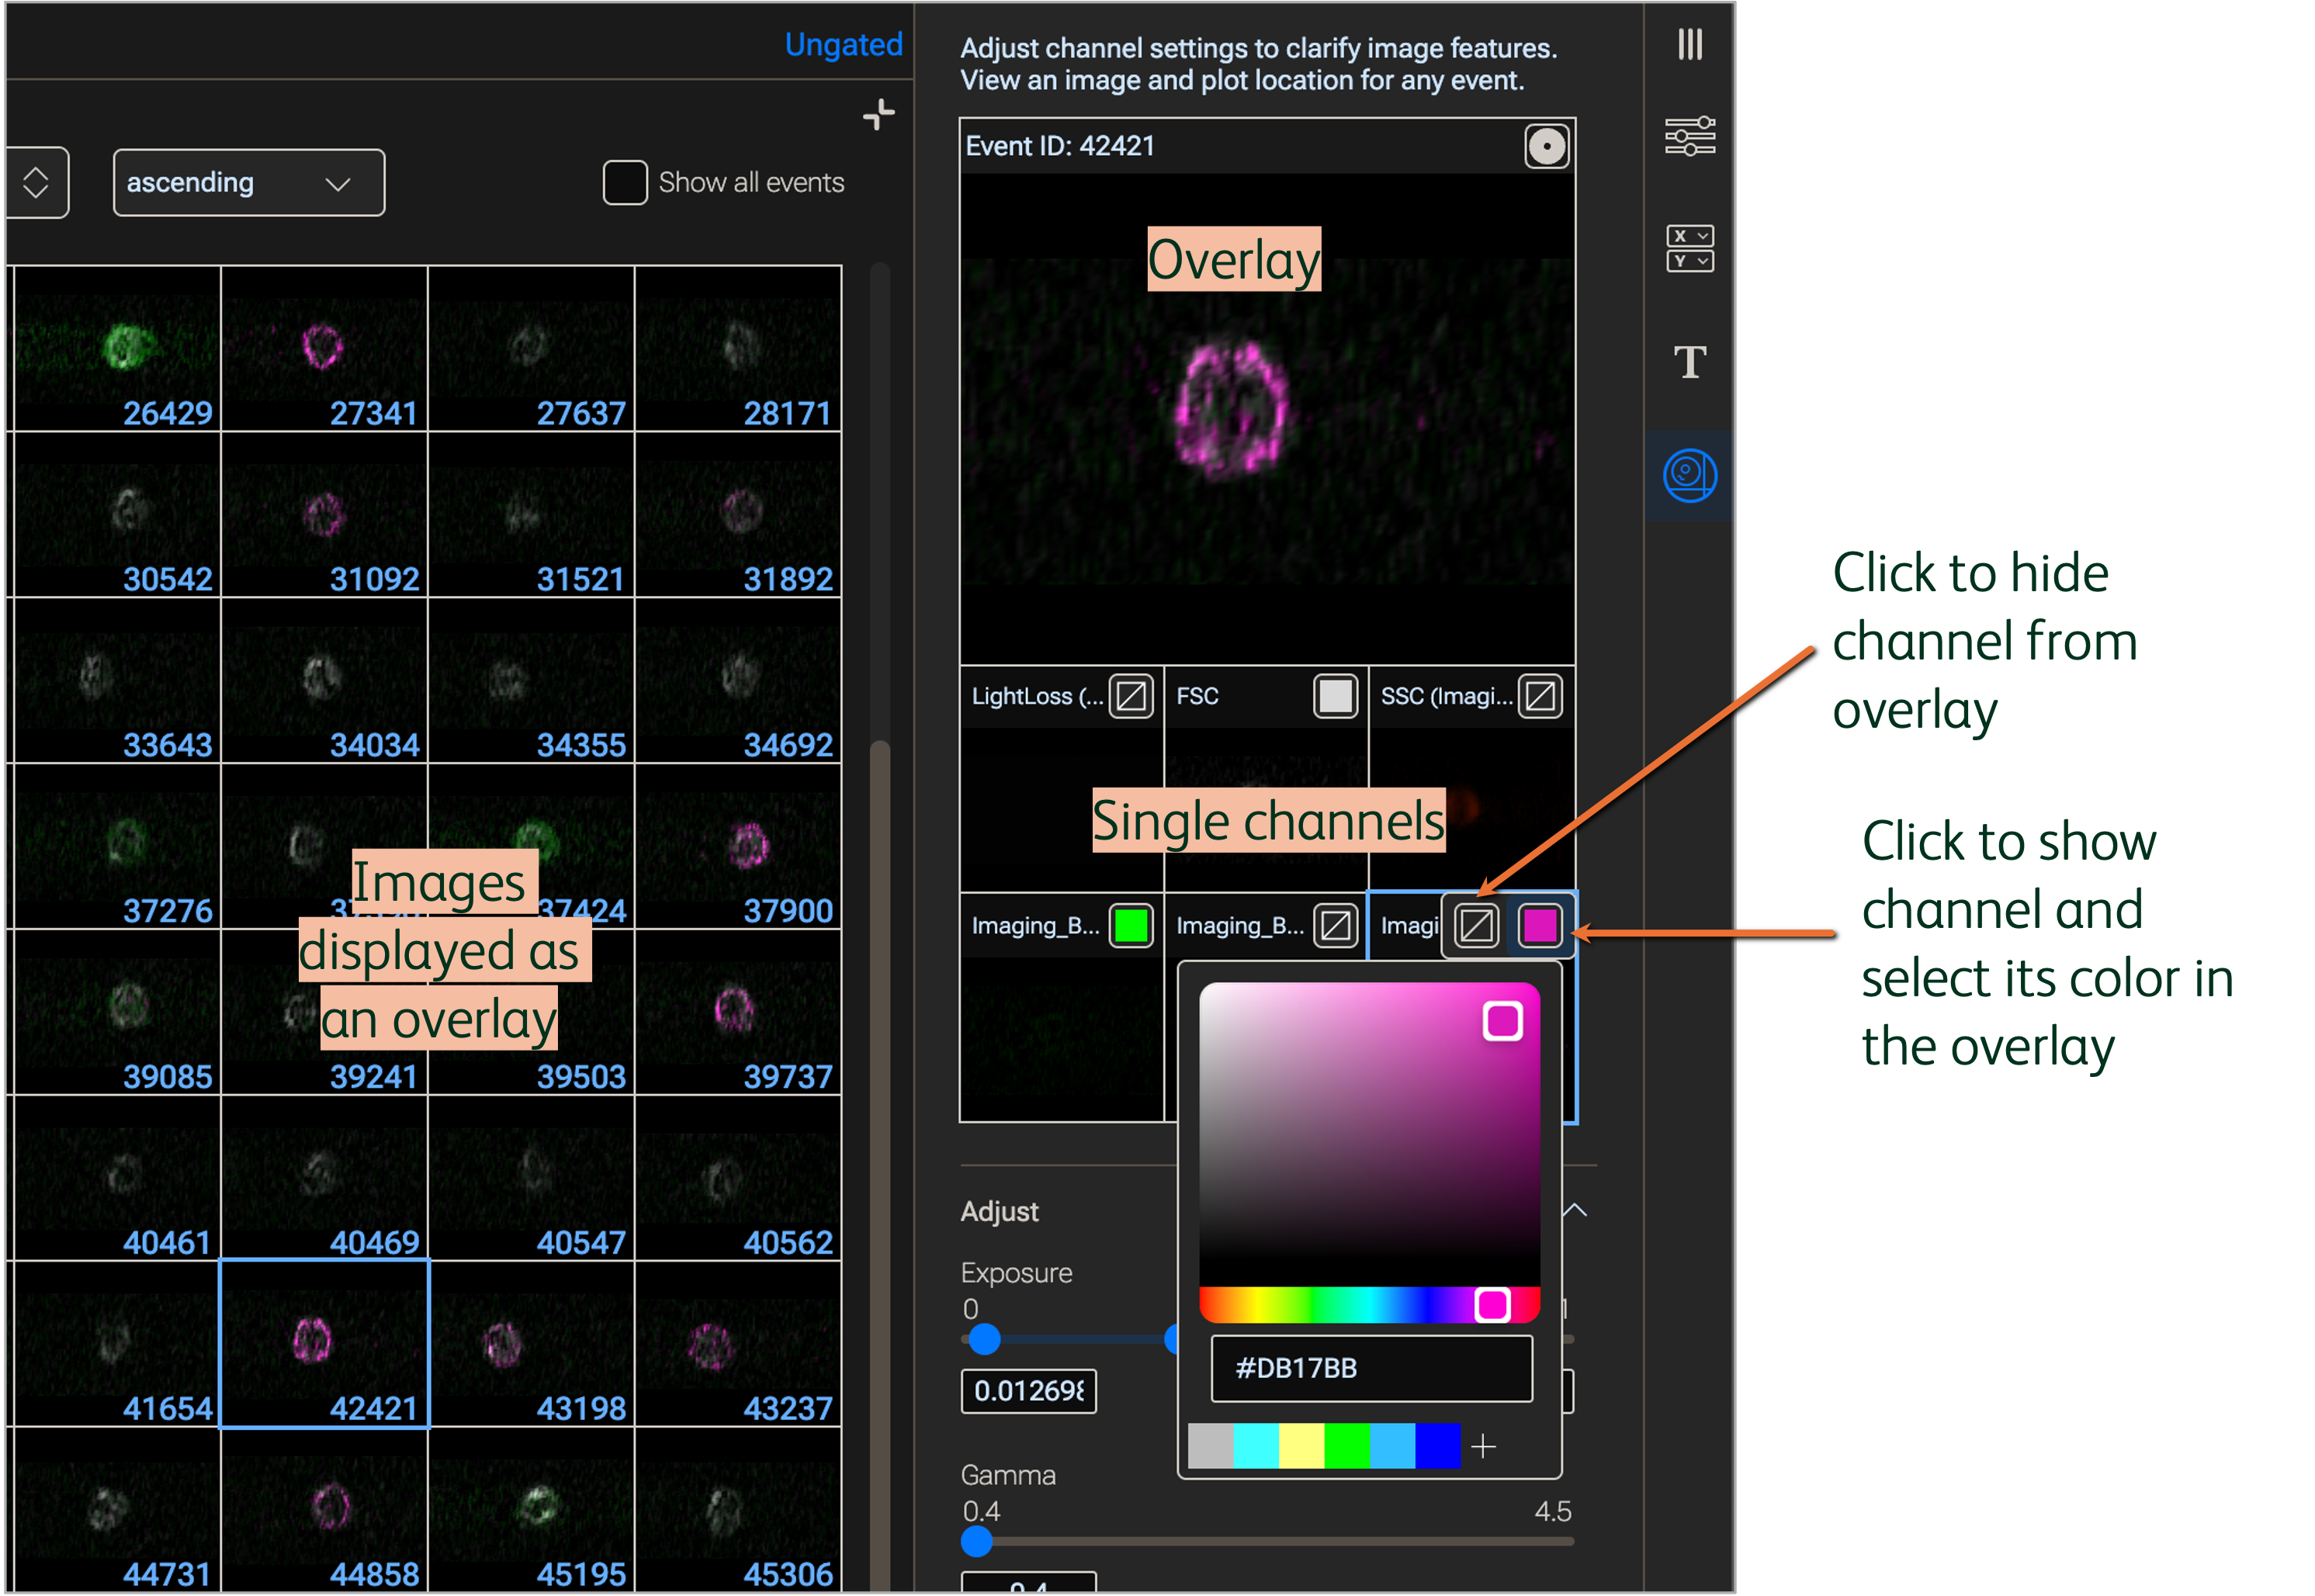
Figure 4. Show or hide channels and modify colors
Modify image settings by clicking the single channel to be adjusted; the tile of the channel being modified will be outlined in a different color (Figure 5). Use the sliders to adjust the following settings.
- Exposure: Controls the intensity of the image signal. Lower values generally increase the overall intensity (i.e. enhance brightness)
- Gamma: Controls the dynamic range of the image signal in a non-linear fashion. Lower values generally increase the range of intensities (i.e. enhance contrast)
- Smoothing: Controls the sharpness of edges in the image. Higher values will generally blur the image.
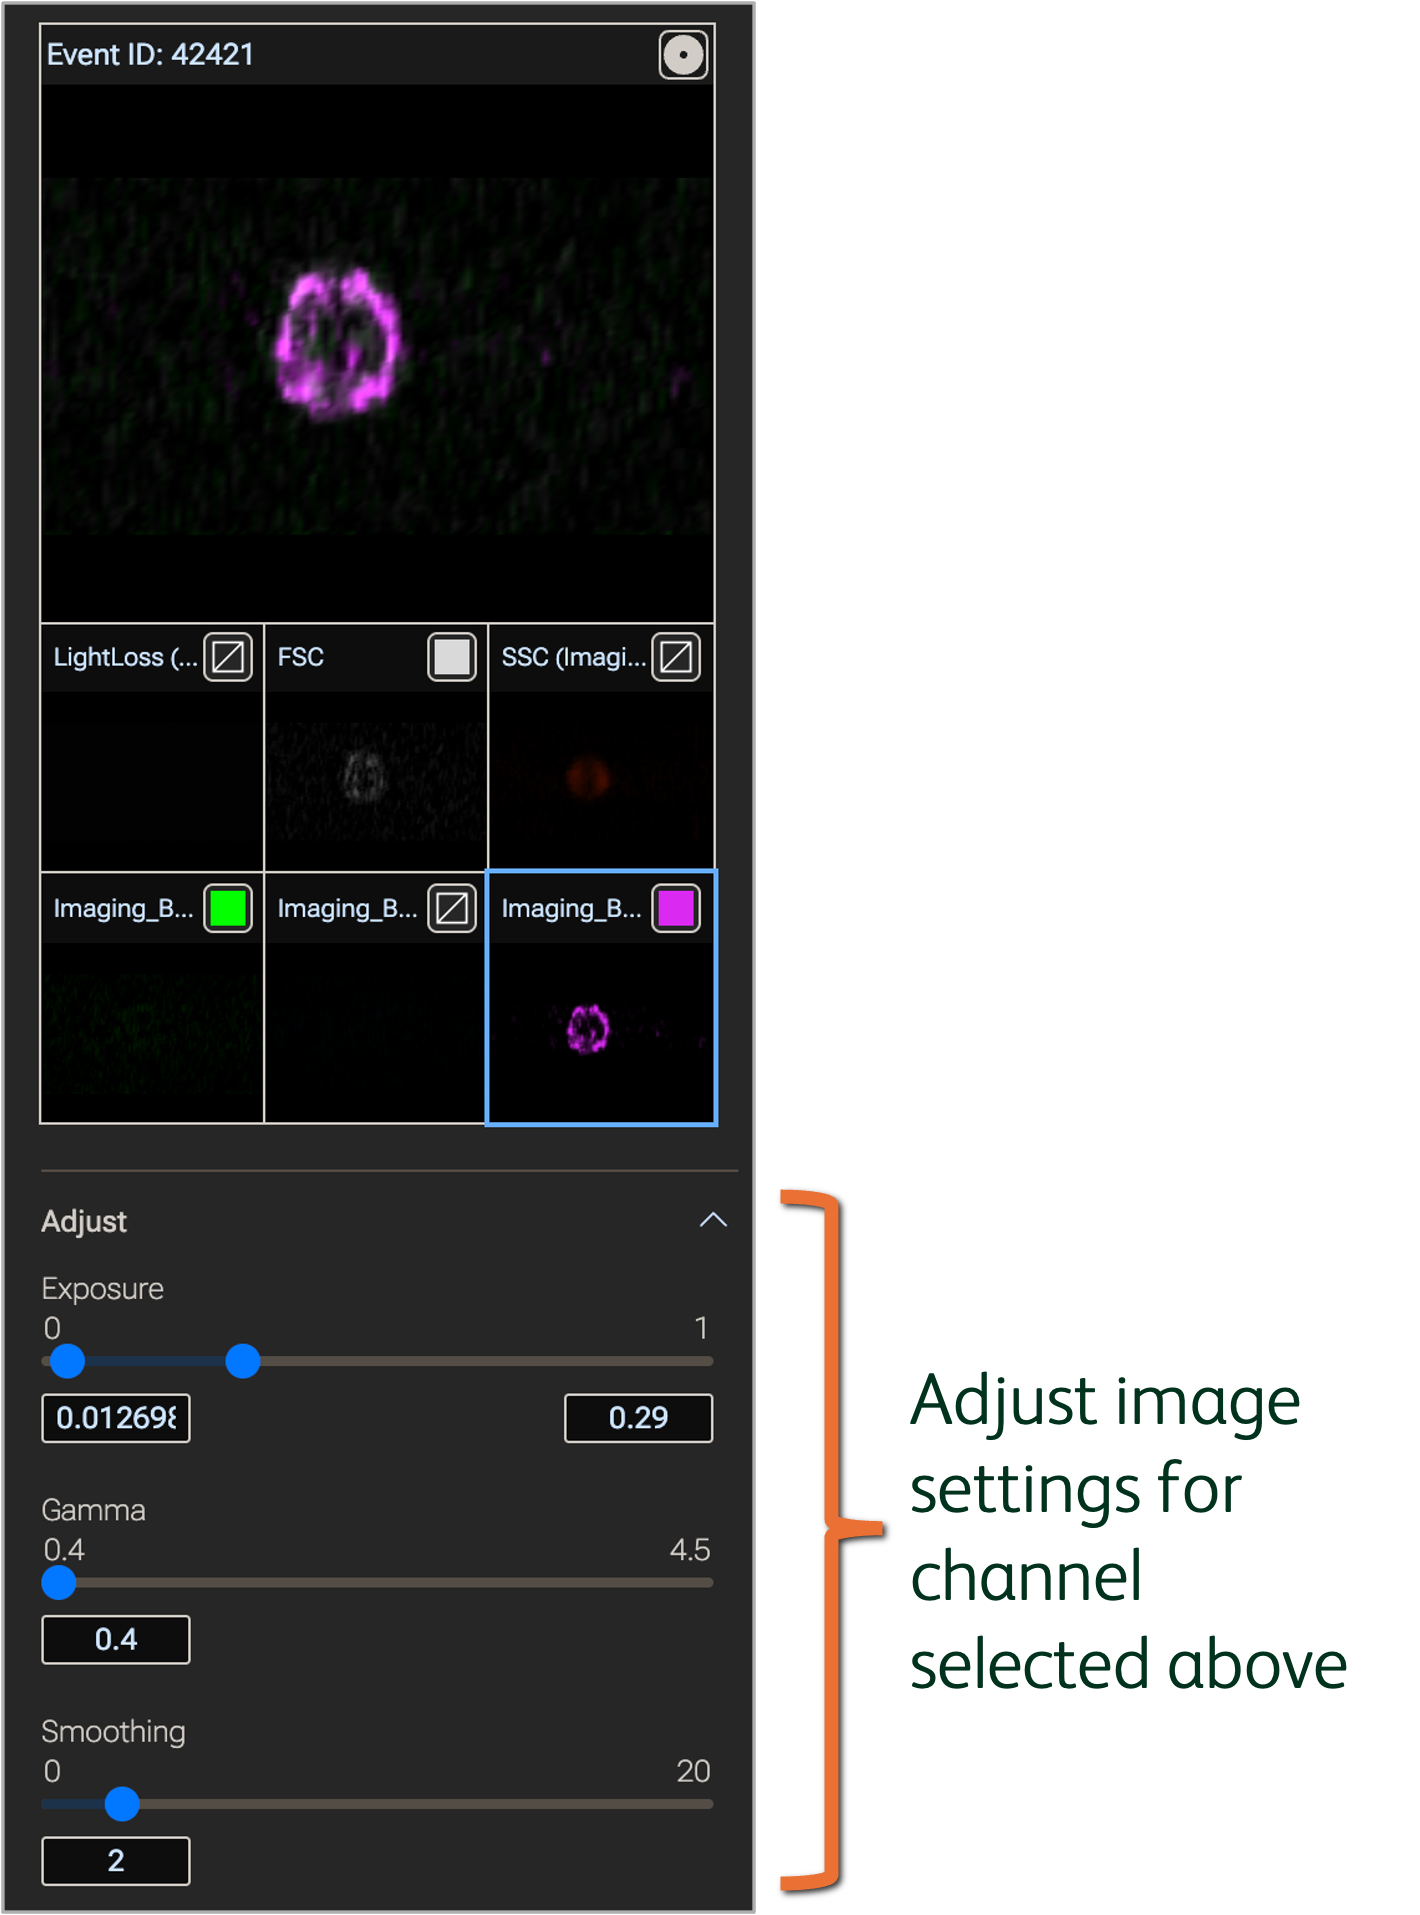
Figure 5. Modify image settings in the Image wall property
Image linking
Interact with images in biaxial plots to confirm gate placement, QC your data, or explore morphological trends within populations defined manually or computationally.
Click the Seeker button in the Image wall property to locate the image’s linked event in the Primary plot; the location will be marked by a Seeker (circular) icon (Figure 6).
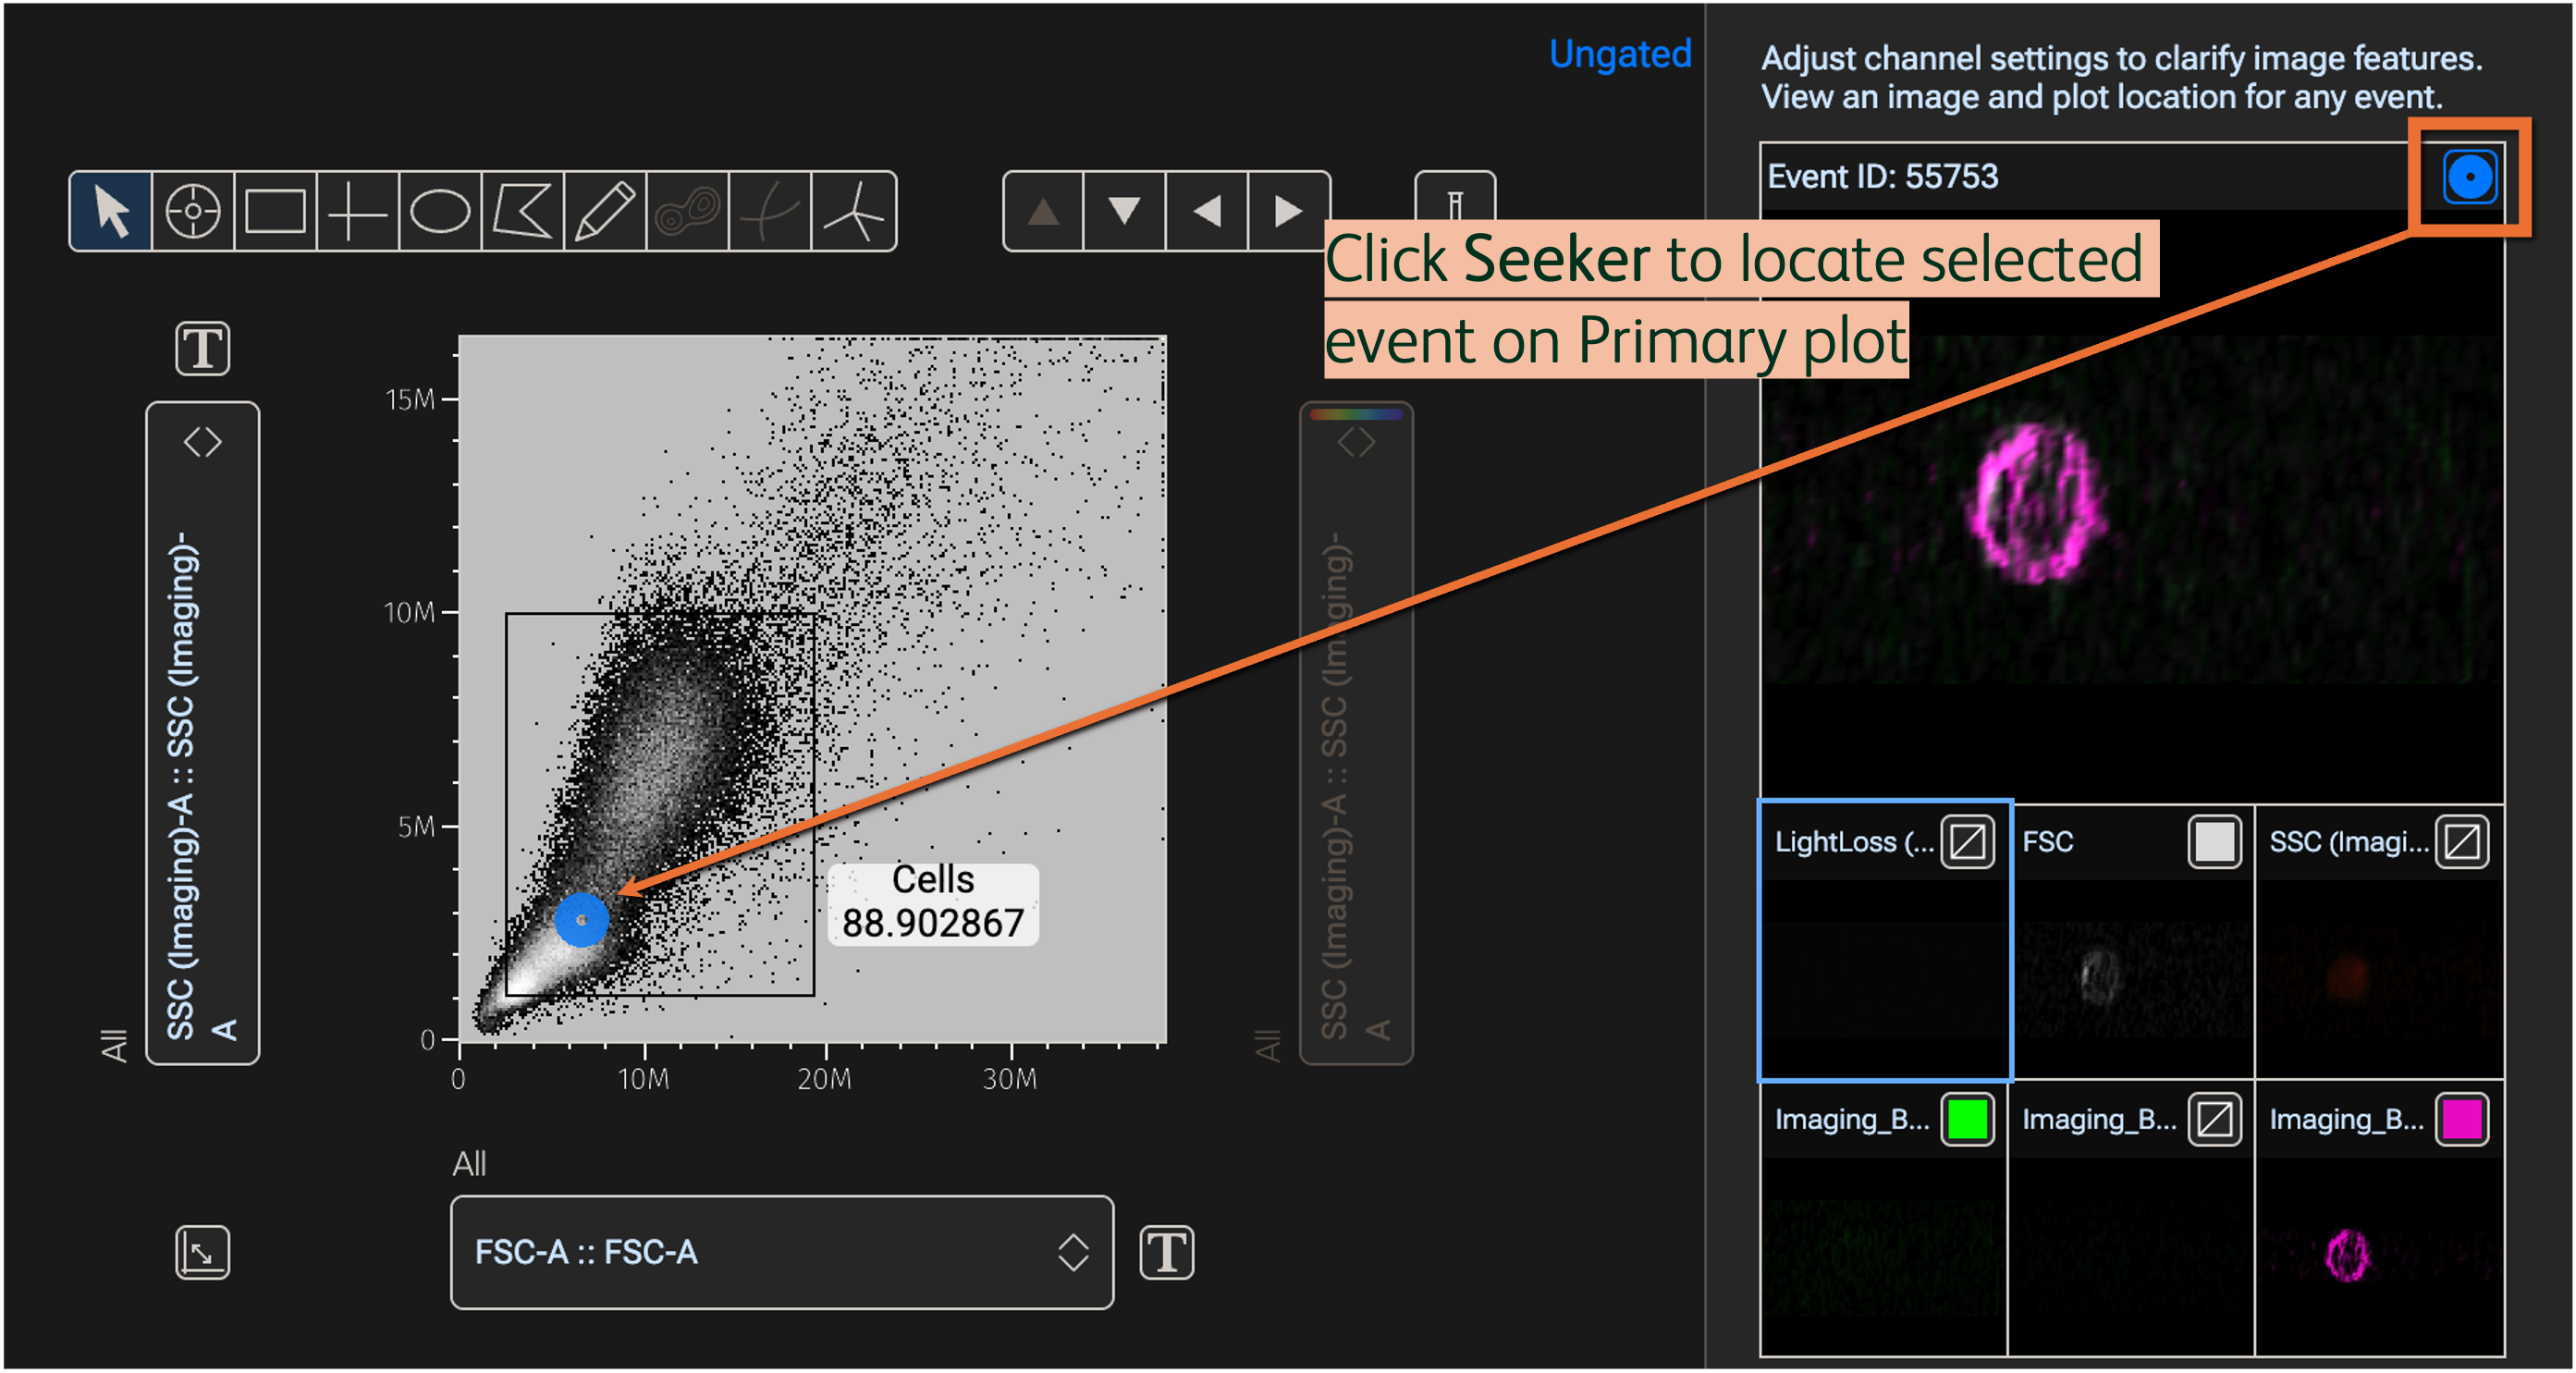
Figure 6. Locate cells in the Primary plot using the Seeker
In the Primary plot, use the Event Inspector in the gating tools to mouse-over events and display linked images within the Primary plot (Figure 7).
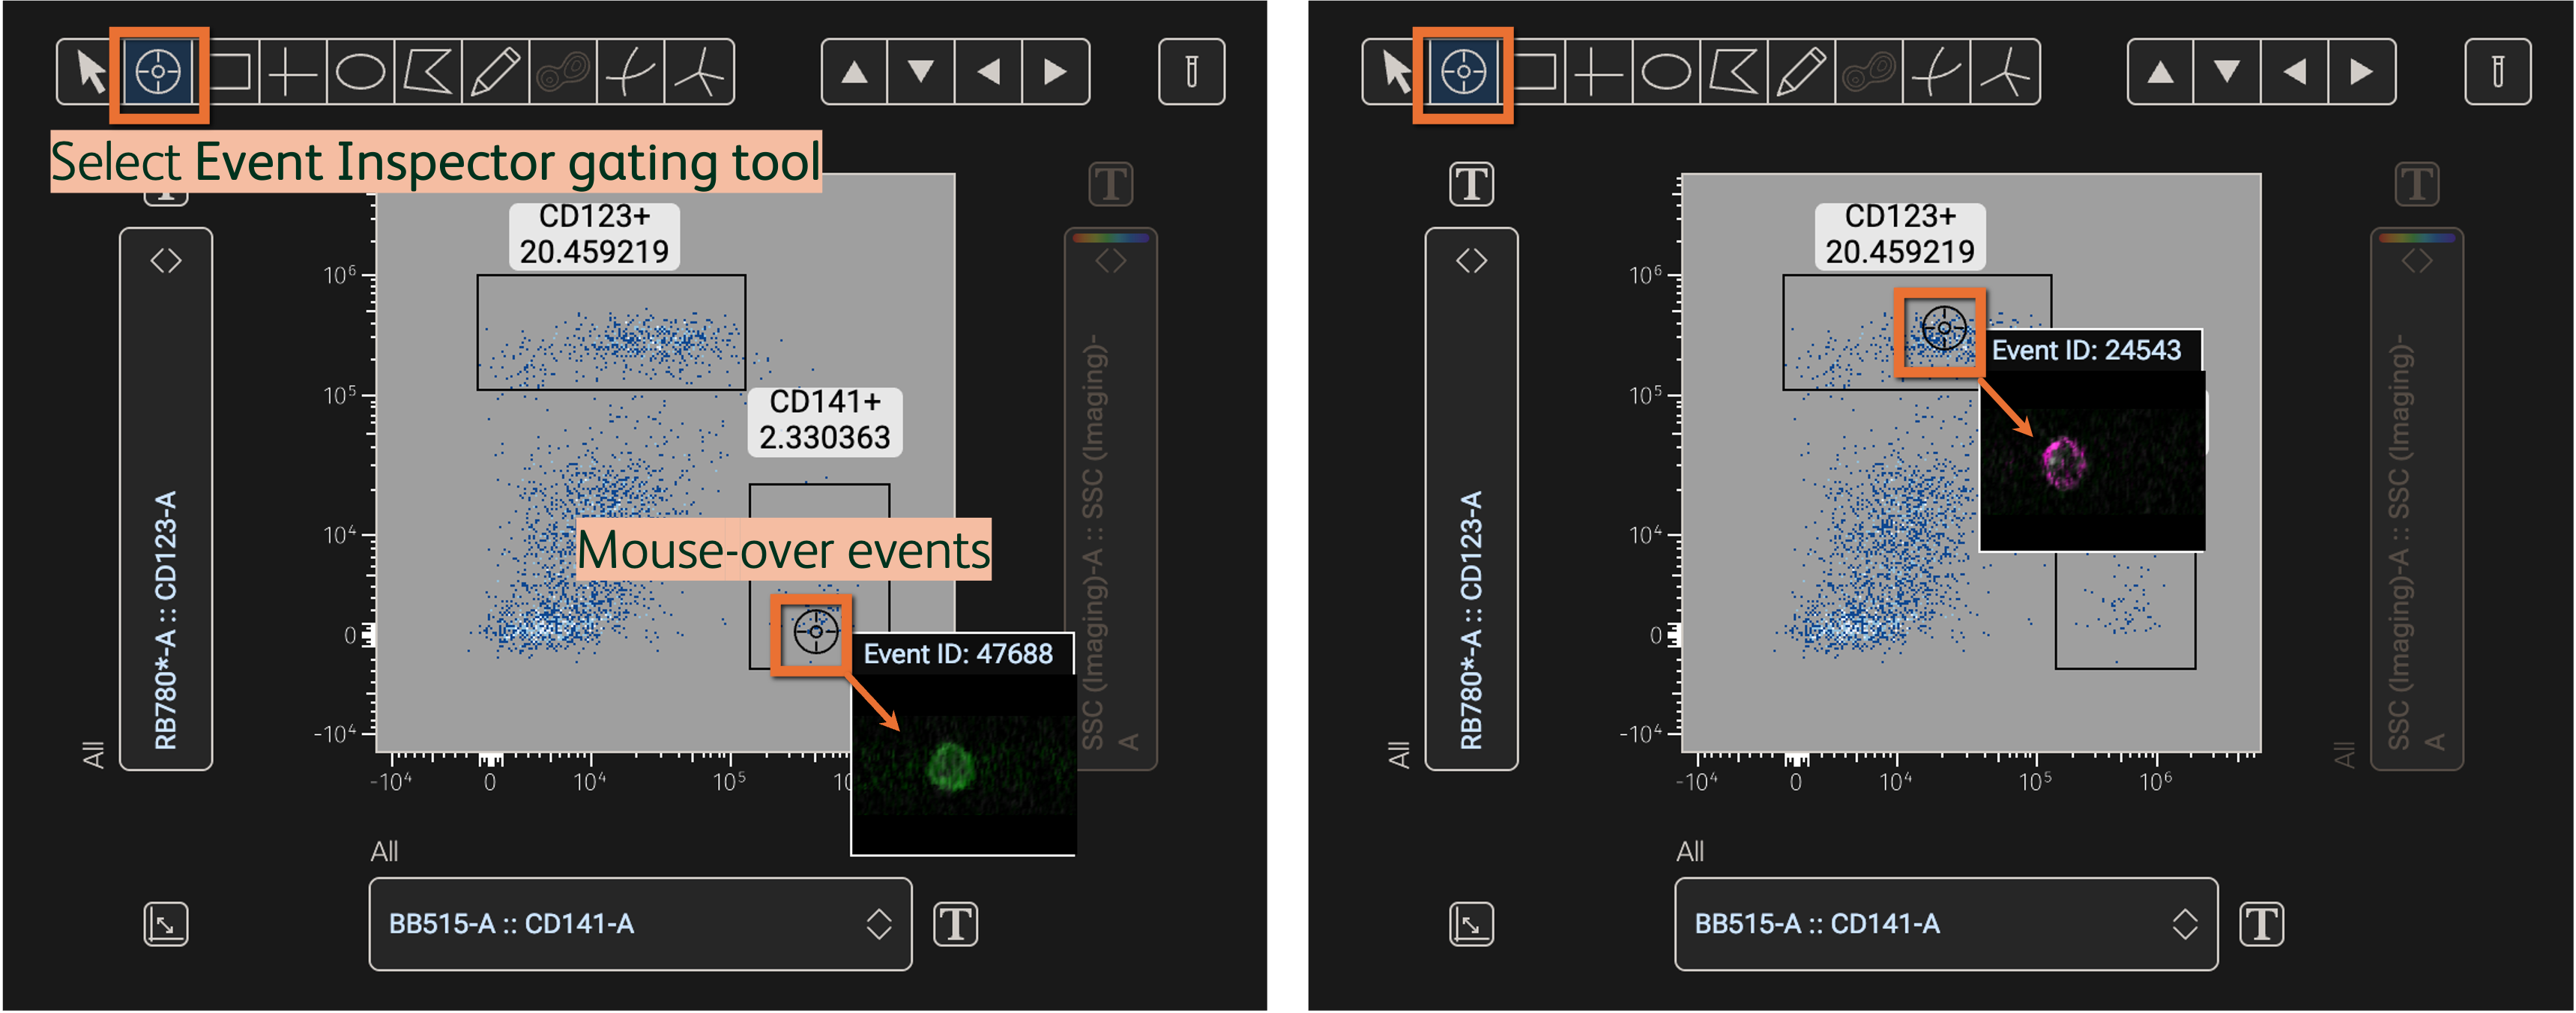
Figure 7. Display images linked to events on the Primary plot with the Event Inspector
Frequently asked questions
Am I manipulating my collected data when adjusting image settings? Modifying image settings only produces visual changes to the signal in the image; the measured value of each imaging parameter and feature per cell will remain unchanged. As with gating populations, FMO and biological negative or positive control samples can be helpful references when optimizing image settings.
Why do some of my channels appear to have no signal? A channel will appear empty if it was not used in the experiment, so confirm which imaging channels were used to measure the target signal(s) in your experiment. In addition, the image selected from the Image wall may be of a cell with no signal in that channel. Try sorting the Image wall by the parameter in question to find a different cell that may express more of the target.
I don’t see any images in the Image wall, what’s causing this? Confirm the CVW has been extracted, and the resultant TIFFs follow the folder structure shown above in Figure 2. It’s also possible that images were not collected for all cells in the FCS file. Cells with no imaging data will be shown in the Image wall view of the Graph gallery with the text No Image Data.
Learn more on Derived Imaging Parameters here.