
The properties panel contains the tools for customizing a chart.
With the Charts tool selected, the properties panel updates to display chart relevant tools.
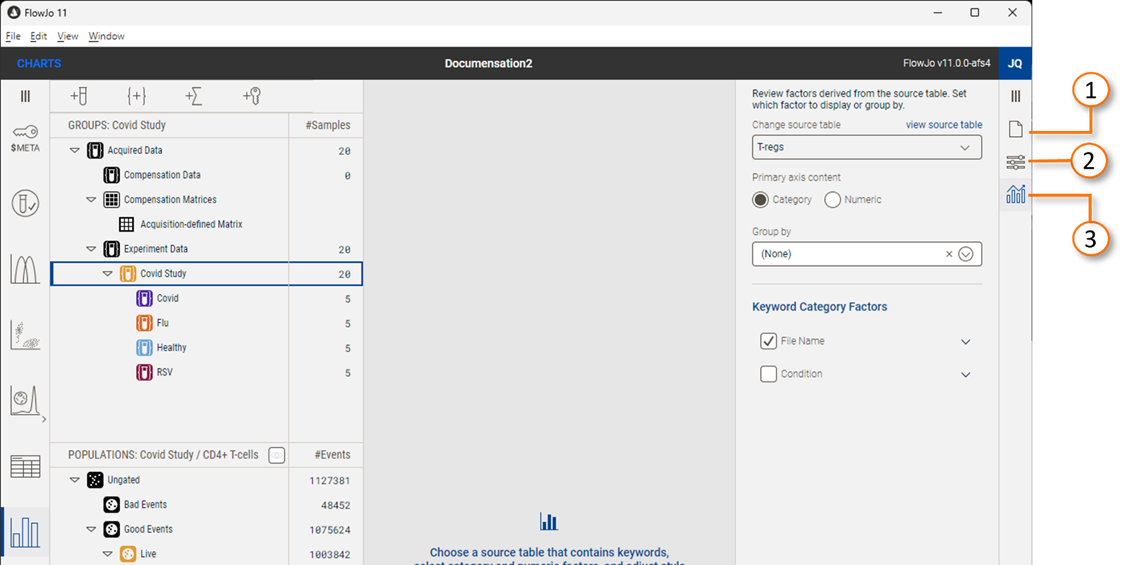
Overview
The charts properties panel has three elements (Figure 1):
| No. | Description |
|---|---|
| 1 | Manage Property |
| 2 | Settings Property |
| 3 | Definition Property |
Figure 1. Chart properties panel elements
Manage
Currently, the manage properties (Figure 2a) are limited to creating, copying, or deleting charts. The + creates a new chart, the overlaid rectangles duplicate an existing one , and the – deletes the selected chart.
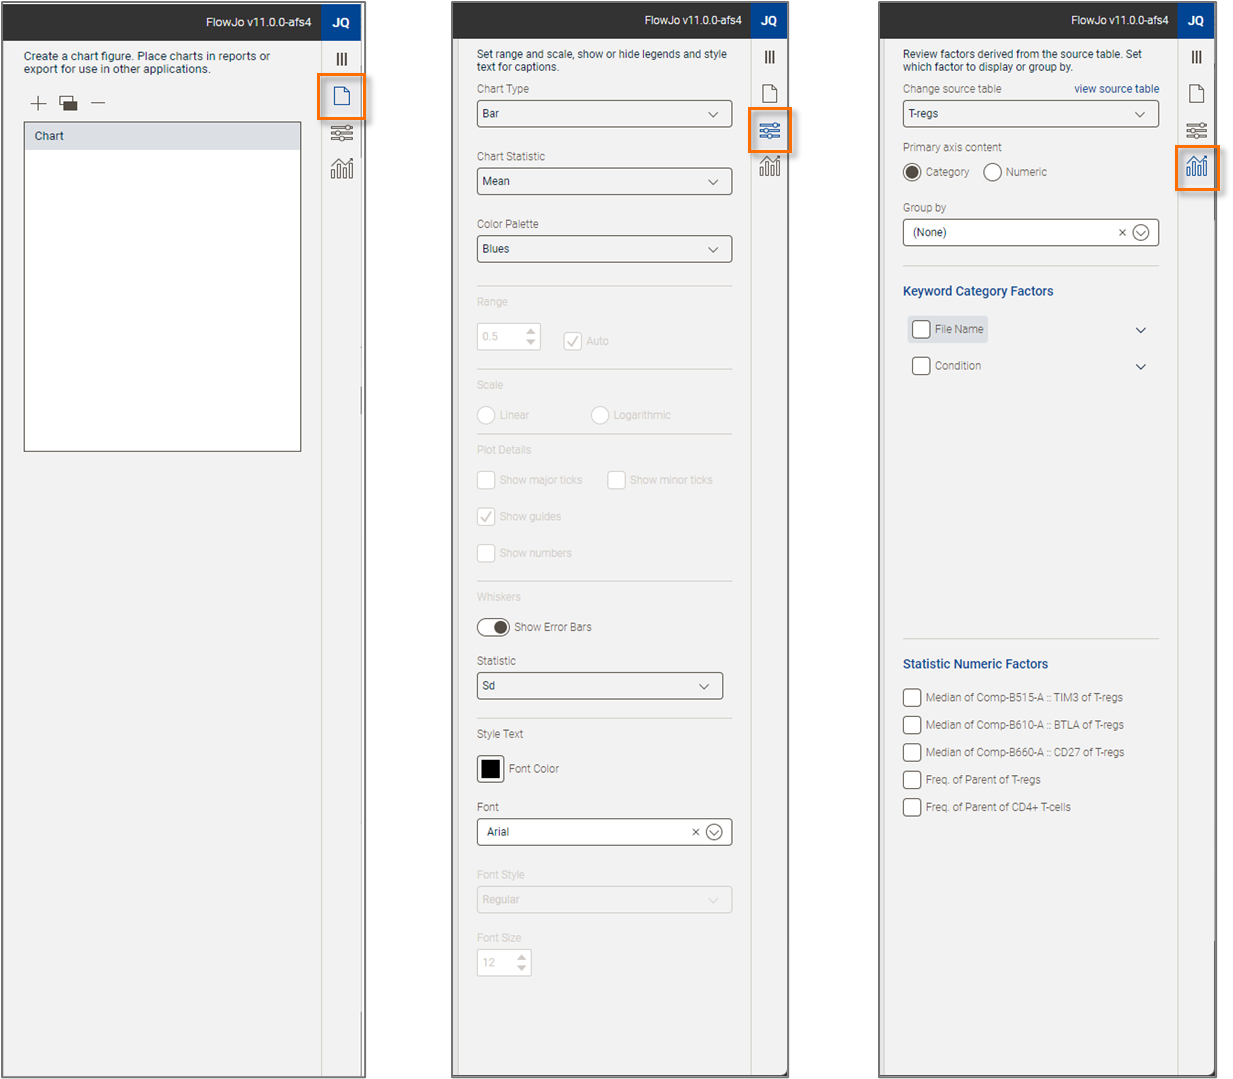
(a) (b) (c)
Figure 2. Chart properties: (a) Manage properties; (b) Settings properties; (c) Definition properties.
Settings properties
The Settings properties control the aesthetics of your chart (Figure 2b).
Chart type
The primary choice is the Chart Type. To change chart type, click on the Chart Type selector (Figure 3) and make a selection. When choosing a type consider the strength of each type:
Bar charts are good for demonstrating magnitudes and can handle multiple categories and multiple measures, for example frequencies of many different populations across multiple time points. In one bar chart it is best to use a single statistic. Mixing statistics with vastly different ranges (i.e. percentages and MFIs) will tend to devalue some statistics.
Pie charts are good for representing results as a fraction of some whole. Multiple pie charts are needed for multiple categories or populations.
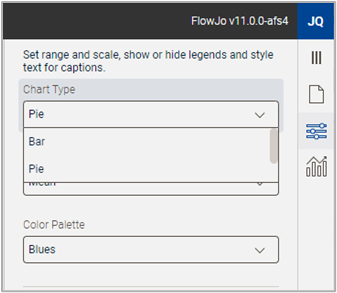
Figure 3. Chart Type selector
Chart Statistic
The chart static choice defines how the columns of data from your table are summarized as a single number in the chart you are creating. Columns in the basis table could be frequencies, MFIs, counts, CVs, etc. from many samples. The number that gets displayed in the chart will either be a mean, sum, or count of these values. The most common selection is mean, which will show an average value of the samples in the table and is invariant to the number of samples per category. For example, if you have 10 healthy samples and 5 samples from donors with a disease, a mean value will show the central tendency of each category without healthy samples dominating the data because there are more. Sums are useful if the total of all values per category is important to answer the biological question you are asking. Count will display the number of measures per category.
Color Palette
The color palette allows you to select a suite of colors that will be applied automatically across categories.
NOTE: As shown in Figure 4, only a single color is needed for differentiation across one category. The lefthand figure shows one statistic displayed across various values of one category. The righthand figure shows multiple colors in use from the selected palette when multiple statistics are selected.
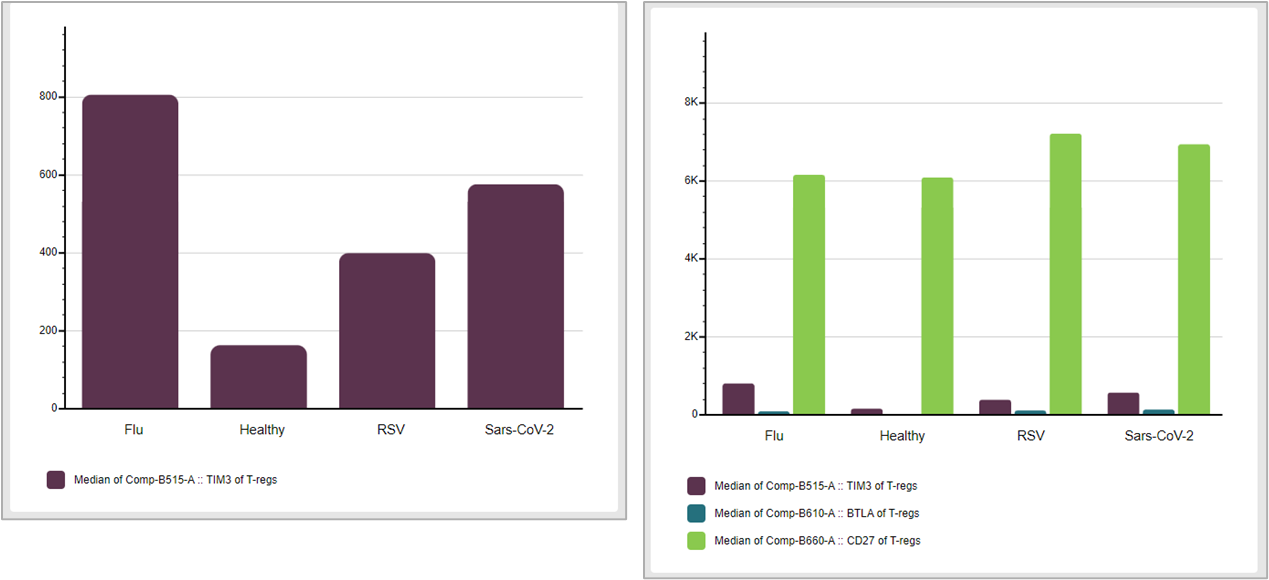
Figure 4. Color palettes applied to one or more factors
Formatting options
Formatting option include:
- The ability to fix the range to a user specified number or allow for auto-scaling. Auto-scaling is the default.
- Set the scale to be linear or logarithmic. Log scales can be useful for displaying mean MFIs.
- Set the plot details, such as showing or hiding major/minor tick marks, guides, or the axis numbers.
- Text controls including font, color, style, and size.
Error Bars
You can display error bars based either on the standard error or the standard deviation.
- Standard deviation is a measure of how disperse data is relative to the mean. The statistic is calculated as the sum of the differences of each data point from the mean, squared to eliminate negatives, divided by the number of samples, and rooted.
- Standard error is the standard deviation divided by the square root of the number of samples. Standard error indicates how different the population mean is likely to be from a sample mean.
Definition properties
The Definition properties are the primary table constructor. The top portion of this properties display defines what data will be used and how it will be oriented: a drop down for Table Selection, and choices to set the Primary Axis (the x axis) to represent categories or numeric values, as well as the ability to group table selections based on a category (Figure 5).

Figure 5. Data definition
Primary axis content
Figure 6 shows the effect of switching the primary axis from category to numeric. In the example below, there is one categoric factor in the data called Condition, which includes the values Flu, Healthy, RSV, and Sars-CoV2. There are two statistics chosen for display, frequency of two different populations. Choosing to display the category on the x-axis arranges the data so that each category is annotated on the x-axis, with color used to differentiate the pair of selected statistics (Figure 6a). In the same example, when the primary axis content is set to Numeric, the same data is arranged by number, where the annotation lists the two frequencies and different colors are used to indicate the categories (Figure 6b).
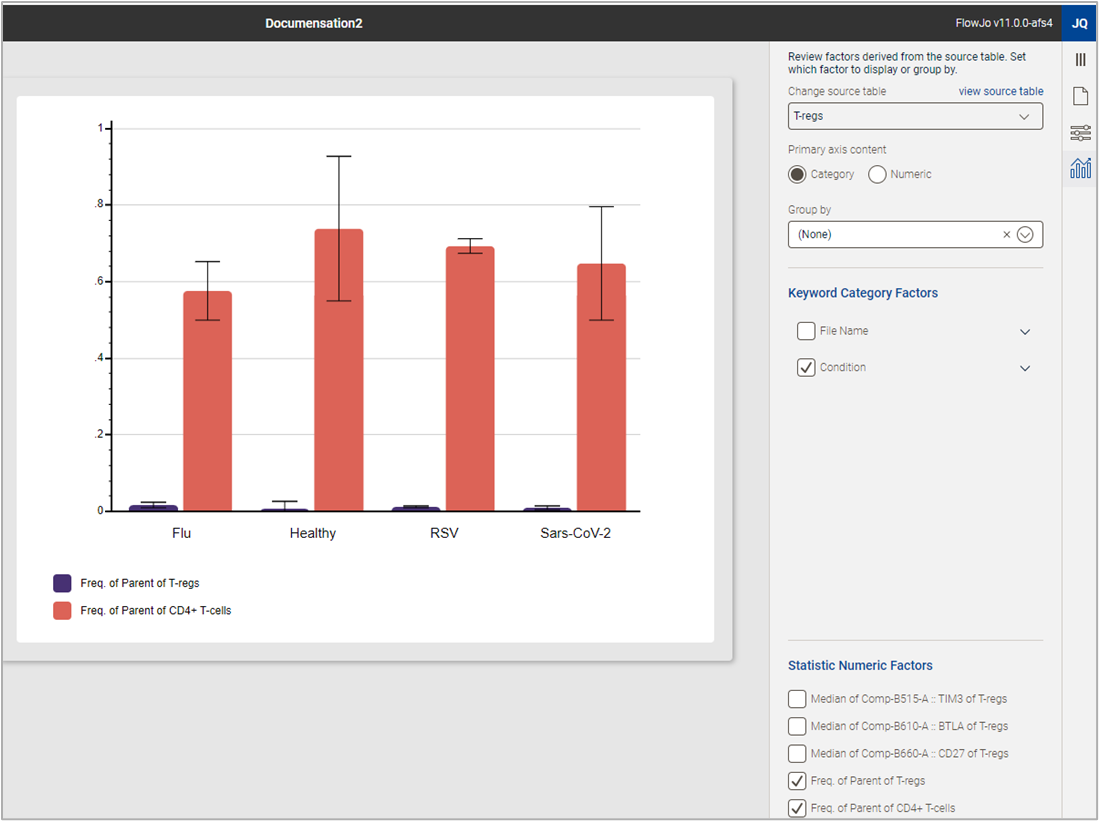
(a)
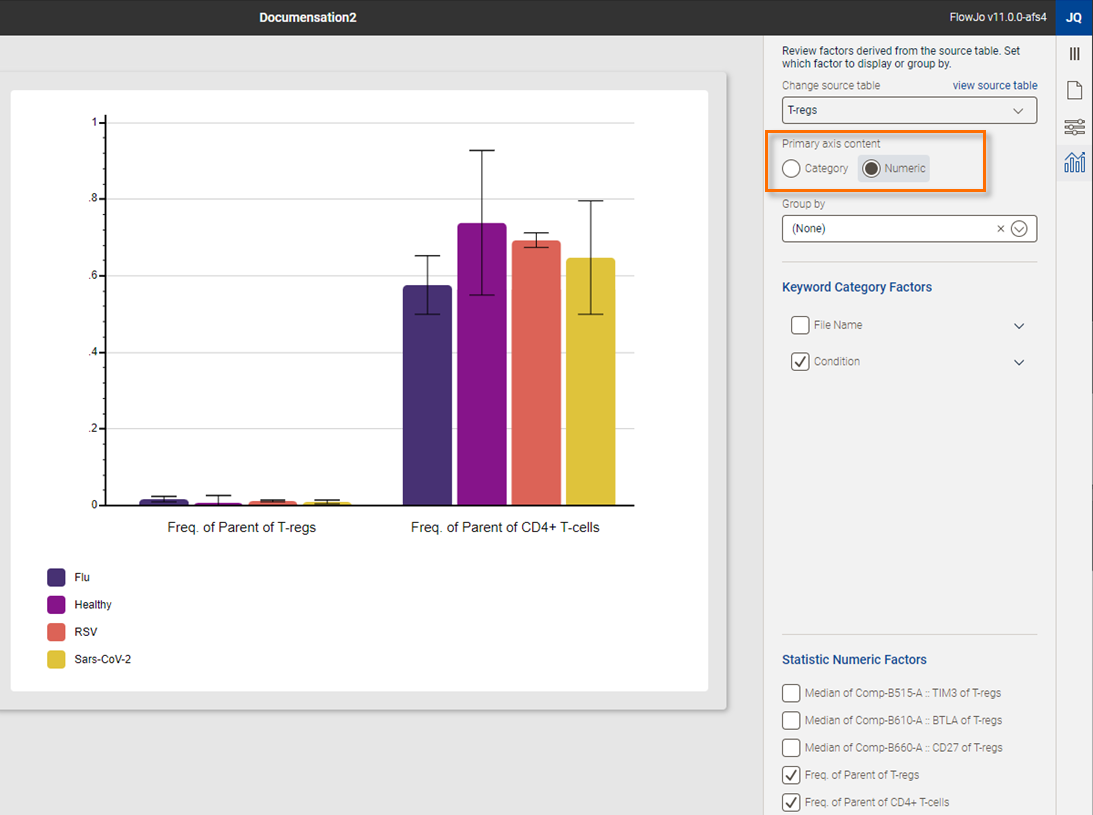
(b)
Figure 6. (a) Data displayed with a category on the x-axis. (b) The same data with numeric information displayed on the x-axis.
Group by
Group by allows you to structure your data into multiple charts organized by either category or a numeric factor as defined by the primary axis selection. The Group by feature can been activated by a selection from the drop-down menu. In the example below, the primary axis is numeric and separate charts have been created for the two frequencies (Statistic).
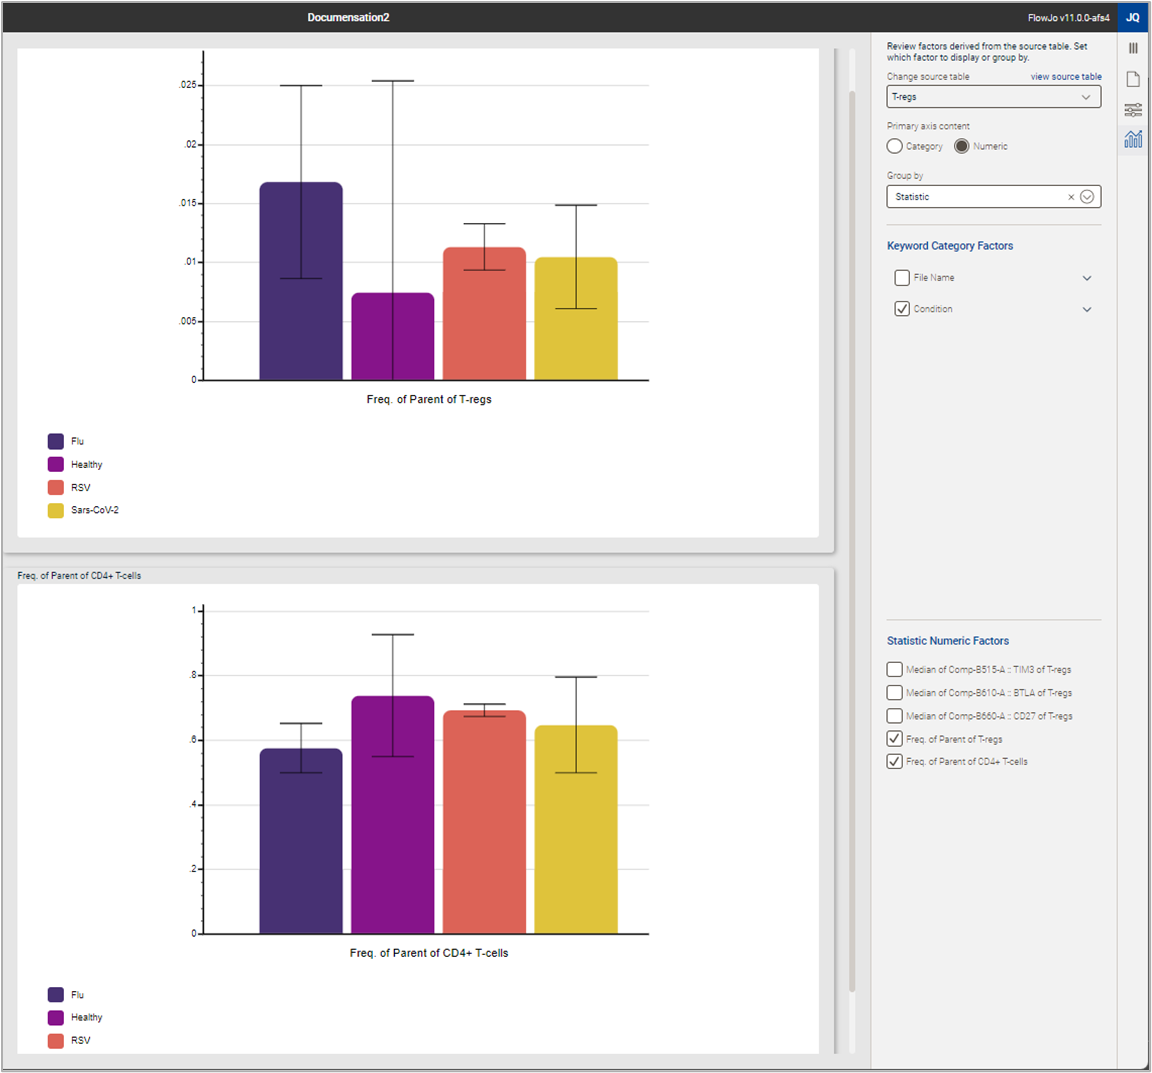
Figure 7. Grouping charts
Keyword Category Factors
This tool allows you to quickly reformat the chart to include any categorical data included in the original table used to generate the chart.In the example below, a menu with the values of Condition expanded via the carrot on the right side of the menu is shown (Figure 8). Checking off any one value of a category removes it from a table, checking an entire factor off removes all values from the chart. Selecting more than one categorical factor creates all Boolean combinations of those factors in your chart.
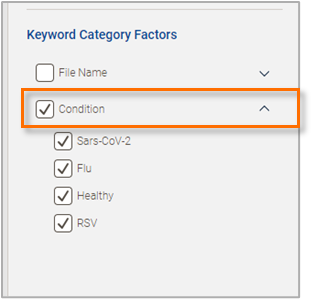
Figure 8. Keyword Category Factors
Statistic Numeric Factors
Just like the category controls, adding or removing a specific statistic from a table is as easy as checking the box. Below you can see the effect of turning off the two frequencies and turning on the medians (Figure 9). Three checks and the chart can display an entirely distinct set of information.
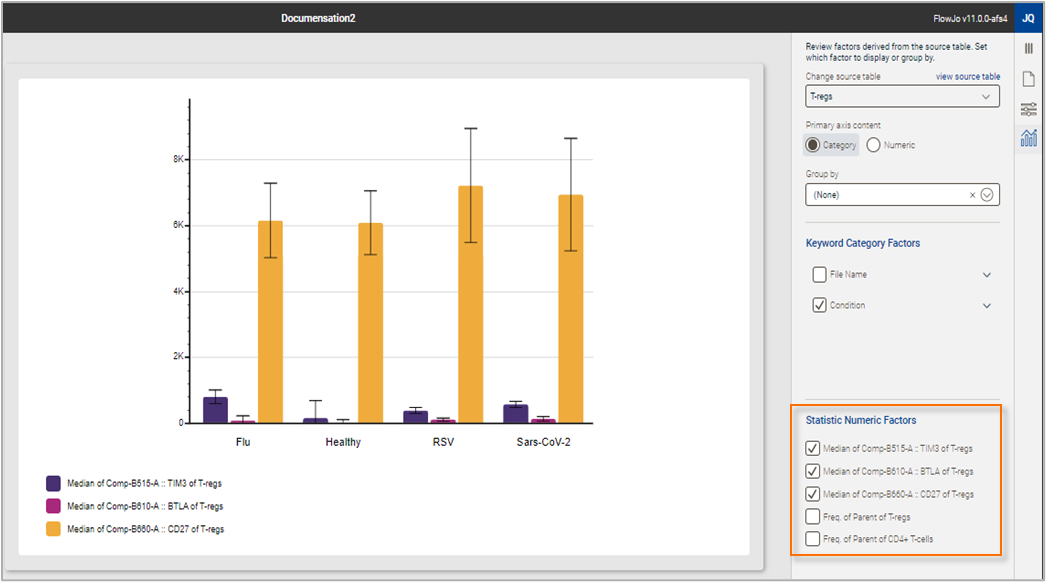
Figure 9. Statistic Numeric Factors
For additional information, see the chart creation example page.