
The Samples panel displays a list of samples that are in the currently selected group. It's primary function is to serve as the selector for actions intended for one specific sample, as well as control what is displayed in Graphs.
The example below illustrates the Samples panel highlighted with an orange box (Figure 1). It's current state is controlled by the selection of the PMA group from the Groups panel, and the Live population from the Populations panel. Only the samples in the PMA group are visible in the Samples panel, and the Count statistic is for the Live population on a per sample basis. Note that the Sample panel impacts the Populations panel by controlling for which sample the #Events statistic is displayed. In this example, the event count for all populations of sample PMA_2_1 is displayed, as that was the sample selected in the Samples panel. You can select a different sample by clicking on it, or by using the up or down arrows to scroll through the list.
Next to each sample are two icons, a grid and a link. The grid indicates if a sample has been compensated/unmixed, and the color refers to the matrix applied to it. The link, if moused over, will display the file path. If the sample has been moved or deleted, the link icon will appear broken and clicking on it will allow you to manually locate the sample.
Clicking on a sample from the Samples panel promotes that sample to the Primary plot. Changing the order of the samples in the Samples panel changes the order in the Graph context. In the example below, the Count statistic was selected to order the samples, using the arrows at the top of the column header to choose either ascending or descending sort order. Changing the selection to another keyword or switching from descending to ascending will automatically change the order in the Graphs context too. Similarly, if you promote a sample in the Graphs context by clicking on it in the Graph gallery, you will see that sample appear selected in the Samples panel.
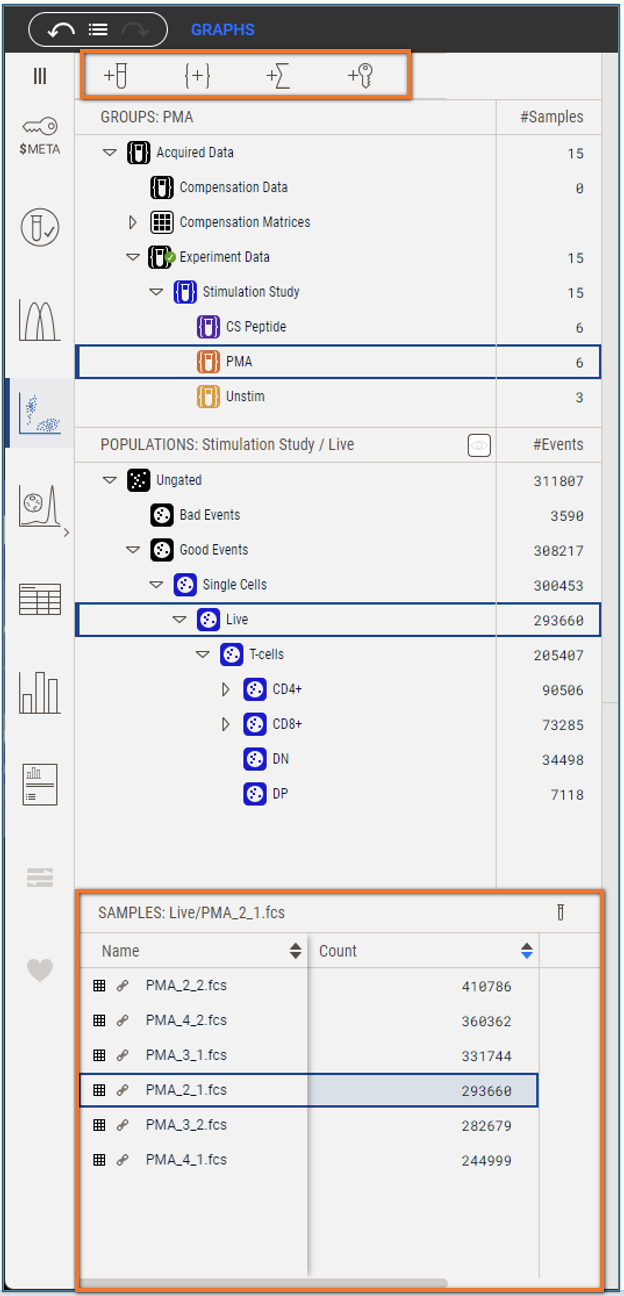
Figure 1. Samples Panel
In this context, within the top level bar (from left to right), there are tools respectively to: add samples, create groups, add statistics, or add keywords to a workbench. Samples, stats, and keywords will all appear in the Samples panel. In the example below, a statistic (Freq. of Parent) and a keyword (Condition) were added (Figure 2).
Pro Tip: You can sort the plots in the Graph gallery or control the order the sample will appear in a batched report by sorting the Sample panel by statistics. This makes it possible to order the data by biggest response or some other metric.
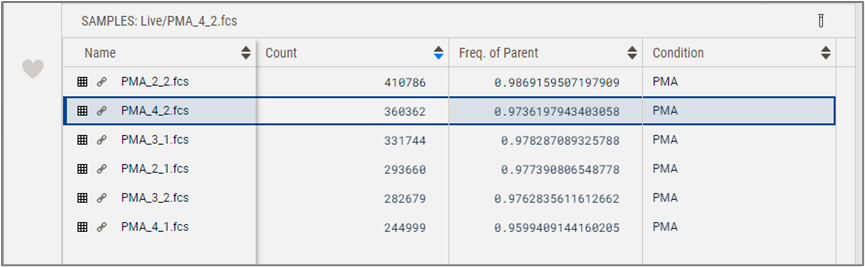
Figure 2. Samples Panel extended with an additional statistic and keyword
Finally, the example below demonstrates the use of the Virtually Concatenated Populations (VCP) button. In VCP mode, the statistics displayed in the Populations panel reflect the combination of all files in the Samples panel. This gives you a feel for the distribution of events across all populations regardless of sample-to-sample variance. Activating VCP mode from the Samples panel also activates it in the Graphs context and vice versa.
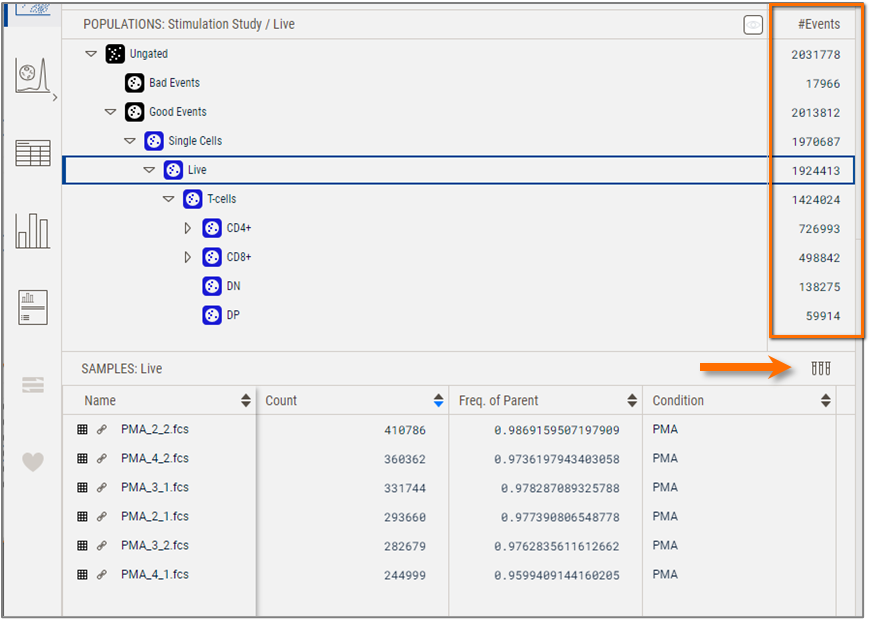
Figure 3. Use of the Virtually Concatenated Populations (VCP) function.