Regions can be useful in examining cell to cell interaction.
The CellView Lens can identify the edges of cells within an image and whether there are more than one. Regions can be created by turning on the Remove Background option within the Image Filter controls. Once calculated, regions can be viewed by clicking on the Regions box in the plugin window as shown in Figure 1. You will notice that the cell wall now shows the region masks as opposed to the cell images. Multiple colors in one image implies that there are more than one cell present.
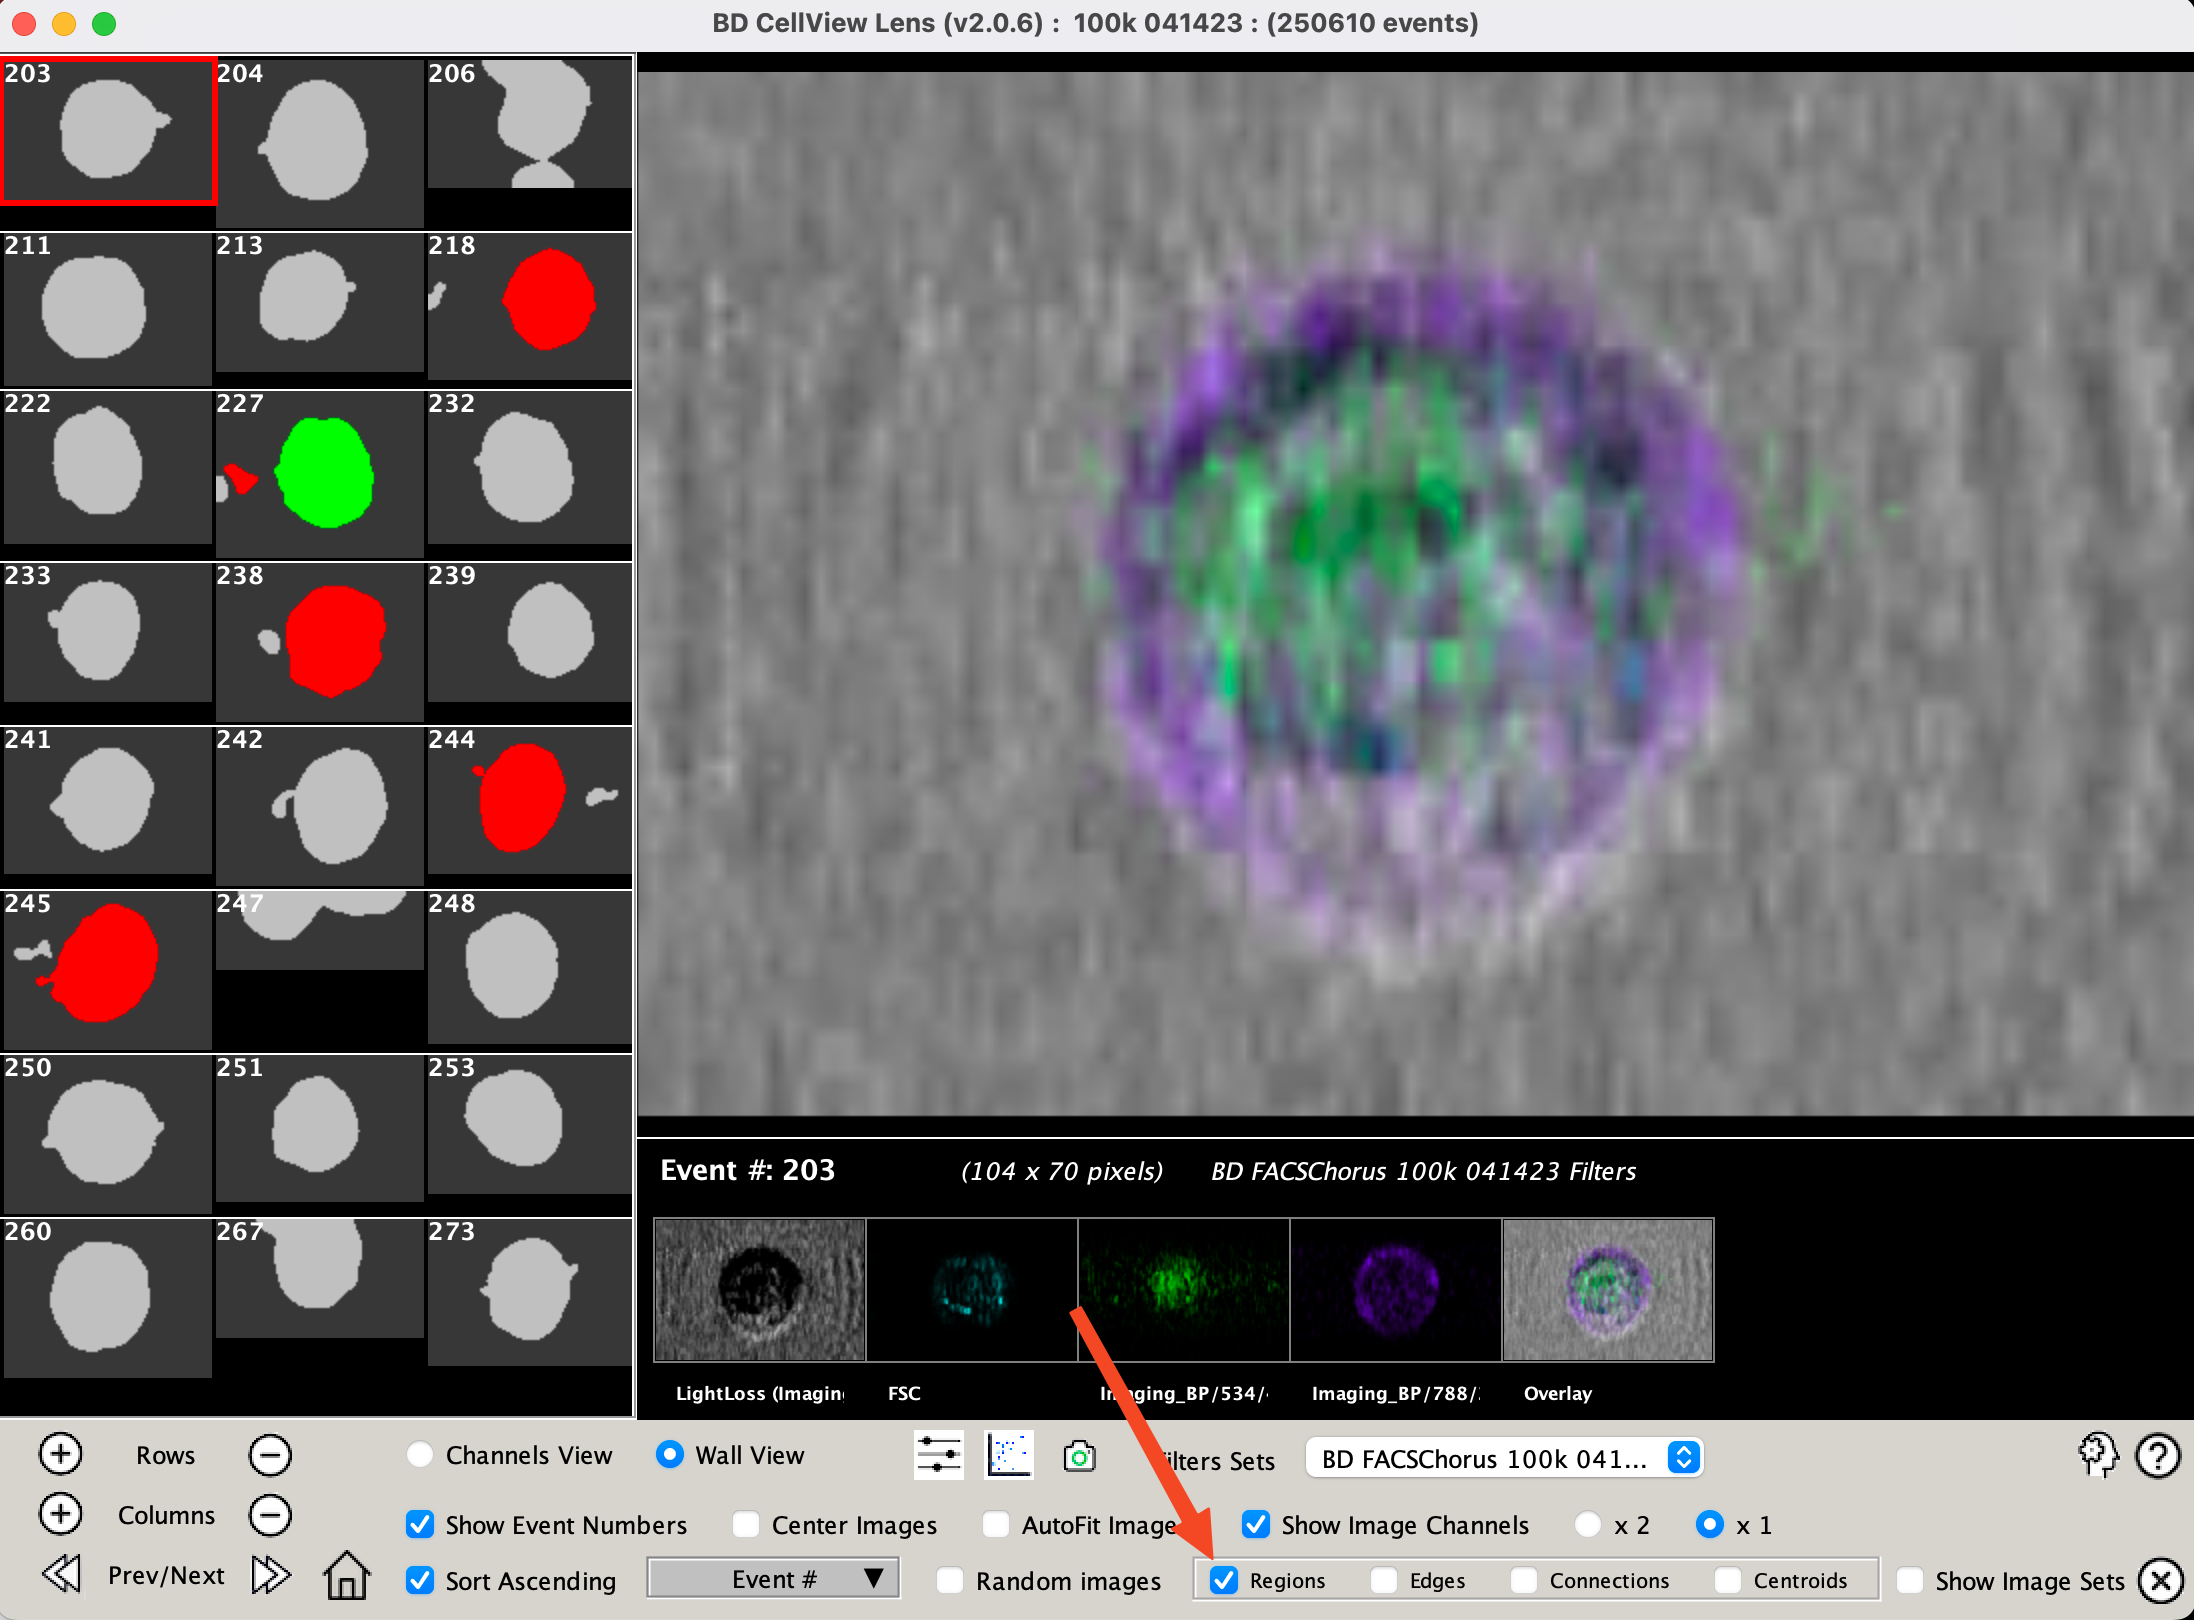
Figure 1 Regions check box
If the Edges and / or Connections boxes are checked the detected edges will be displayed and/or a line showing the minimum distance between the edges is drawn, as shown in Figure 2. If the Centroids box is checked the connection will be draw between the Centroids of the identified regions.
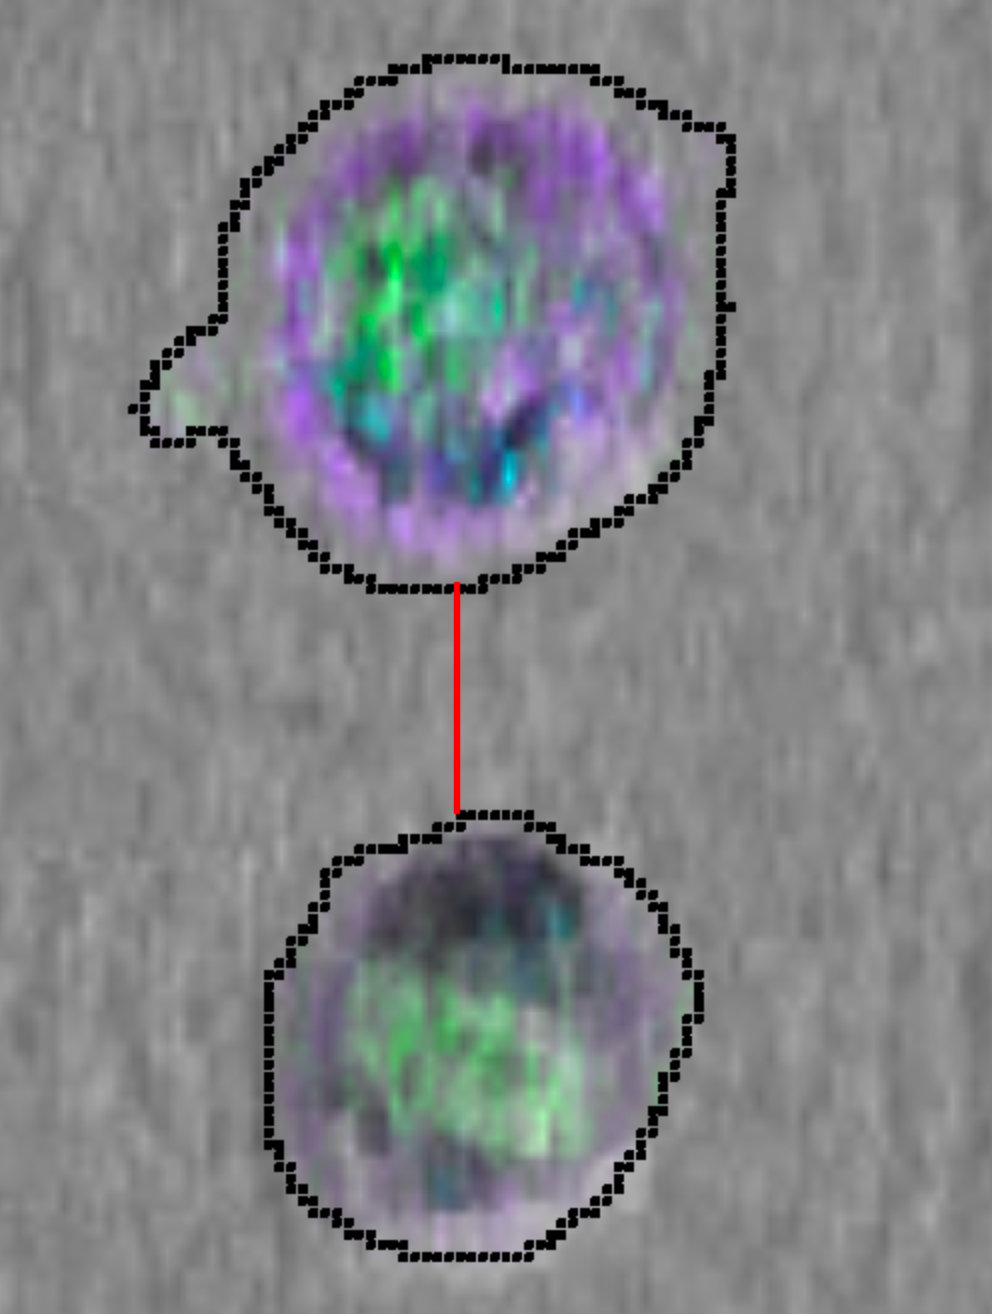
Figure 2 An image with edges and Connections turned on
Beyond making nice visualizations, regions, sub-regions, and the distance between sub-regions can be used to sort or identify interesting populations. A series of statistics related to regions can be calculated by:
- Turning on Remove Background in the Image Filter tool
- Creating a CellView Lens node on the root population in the FlowJo hierarchy
- Opening that node and selecting Make Image Parameters from the Tools menu as shown in Figure 3
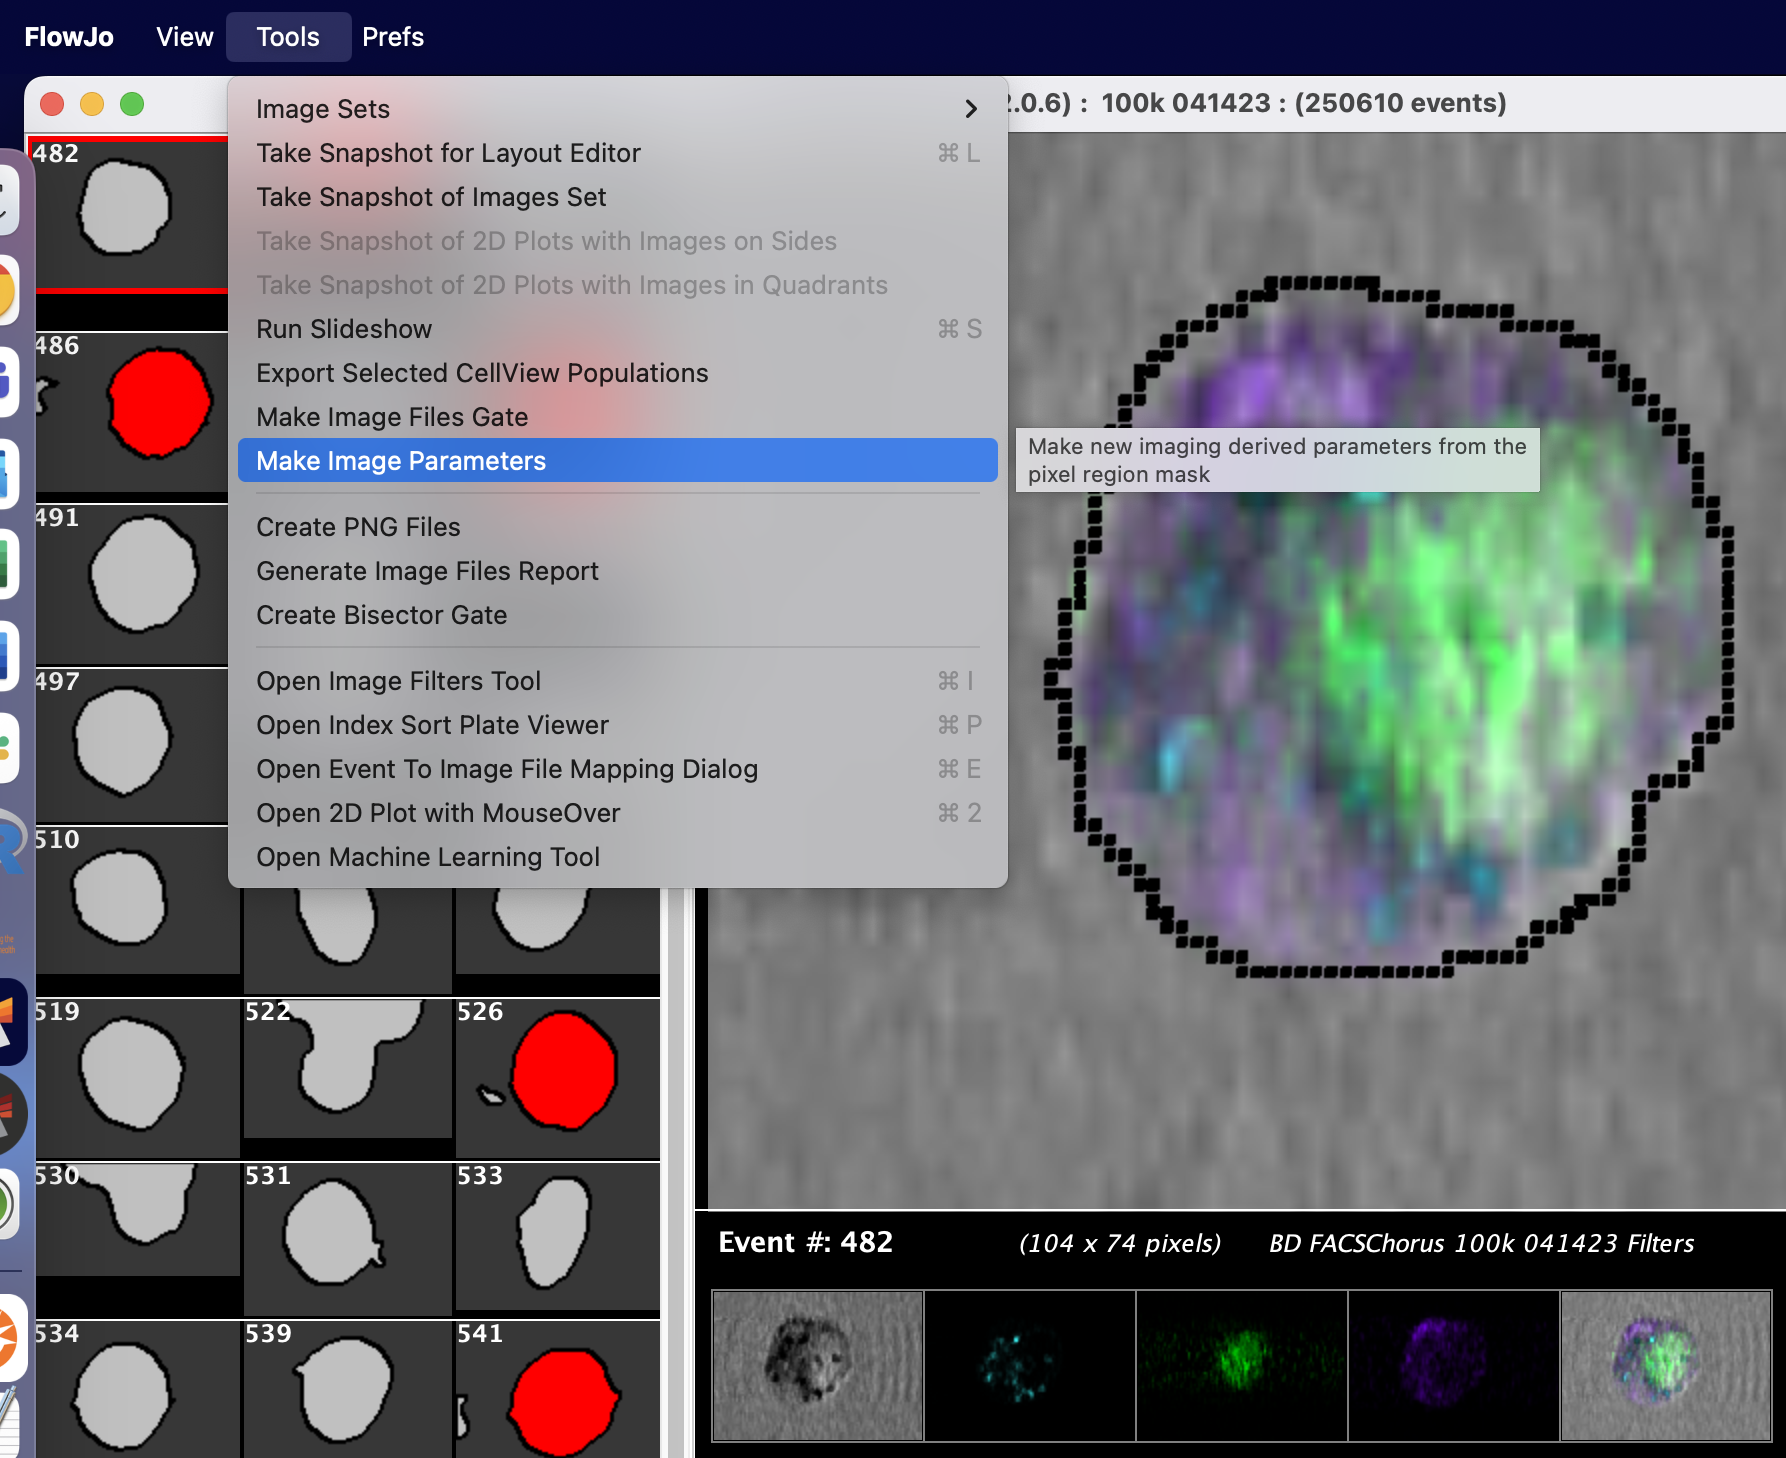
Figure 3 Make Image Parameters tool
The calculation will take a little time depending on how many cells with images are your experiment, but on completion a set of derived parameters will be created as shown in Figure 4.
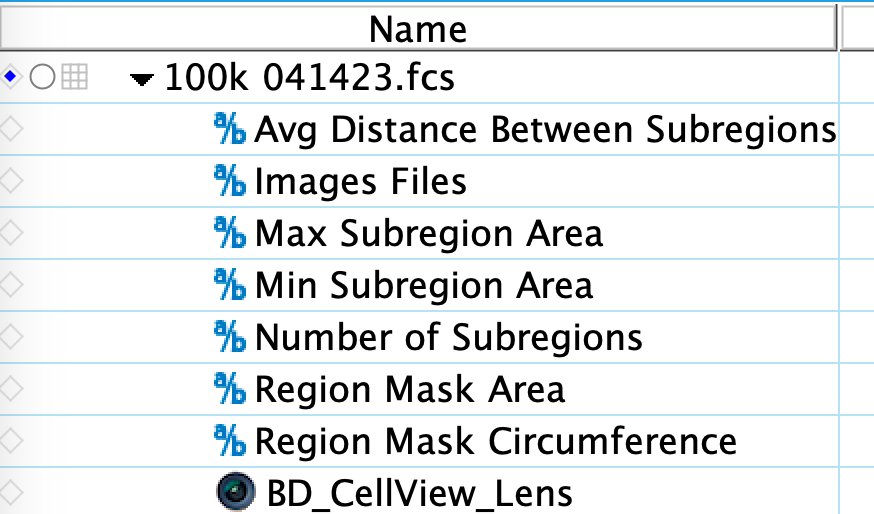
Figure 4 Derived parameters related to regions
These derived parameters are now available in the parameter list of any subset of this root population. They can be displayed on an axis and gated to separate events with the most sub-regions or the greatest distance between sub-regions. Figure 5 shows using the Number of Subregions as a parameter to observe that there are many cells with no regions (those are cells for which an image was not collected), many cells with one region, a few with two and three, and a handful of cells with more. A gate has been drawn on the plot to isolate events that have more than one region for further study.
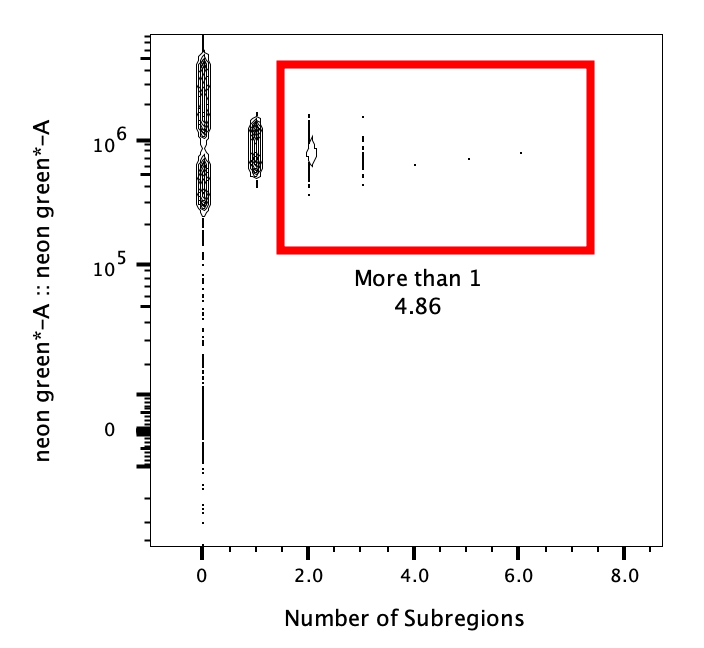
Figure 5 Graphing Number of Subregions and gating on it.
These statistics are also available in the CellView Lens plugin window as options for sorting. Figure 6 displays an example of using gates in FlowJo to identify a population of dividing cells, then sorting by the Number of regions so that the events with the fewest regions can be selected for to remove images that contain cell fragments.
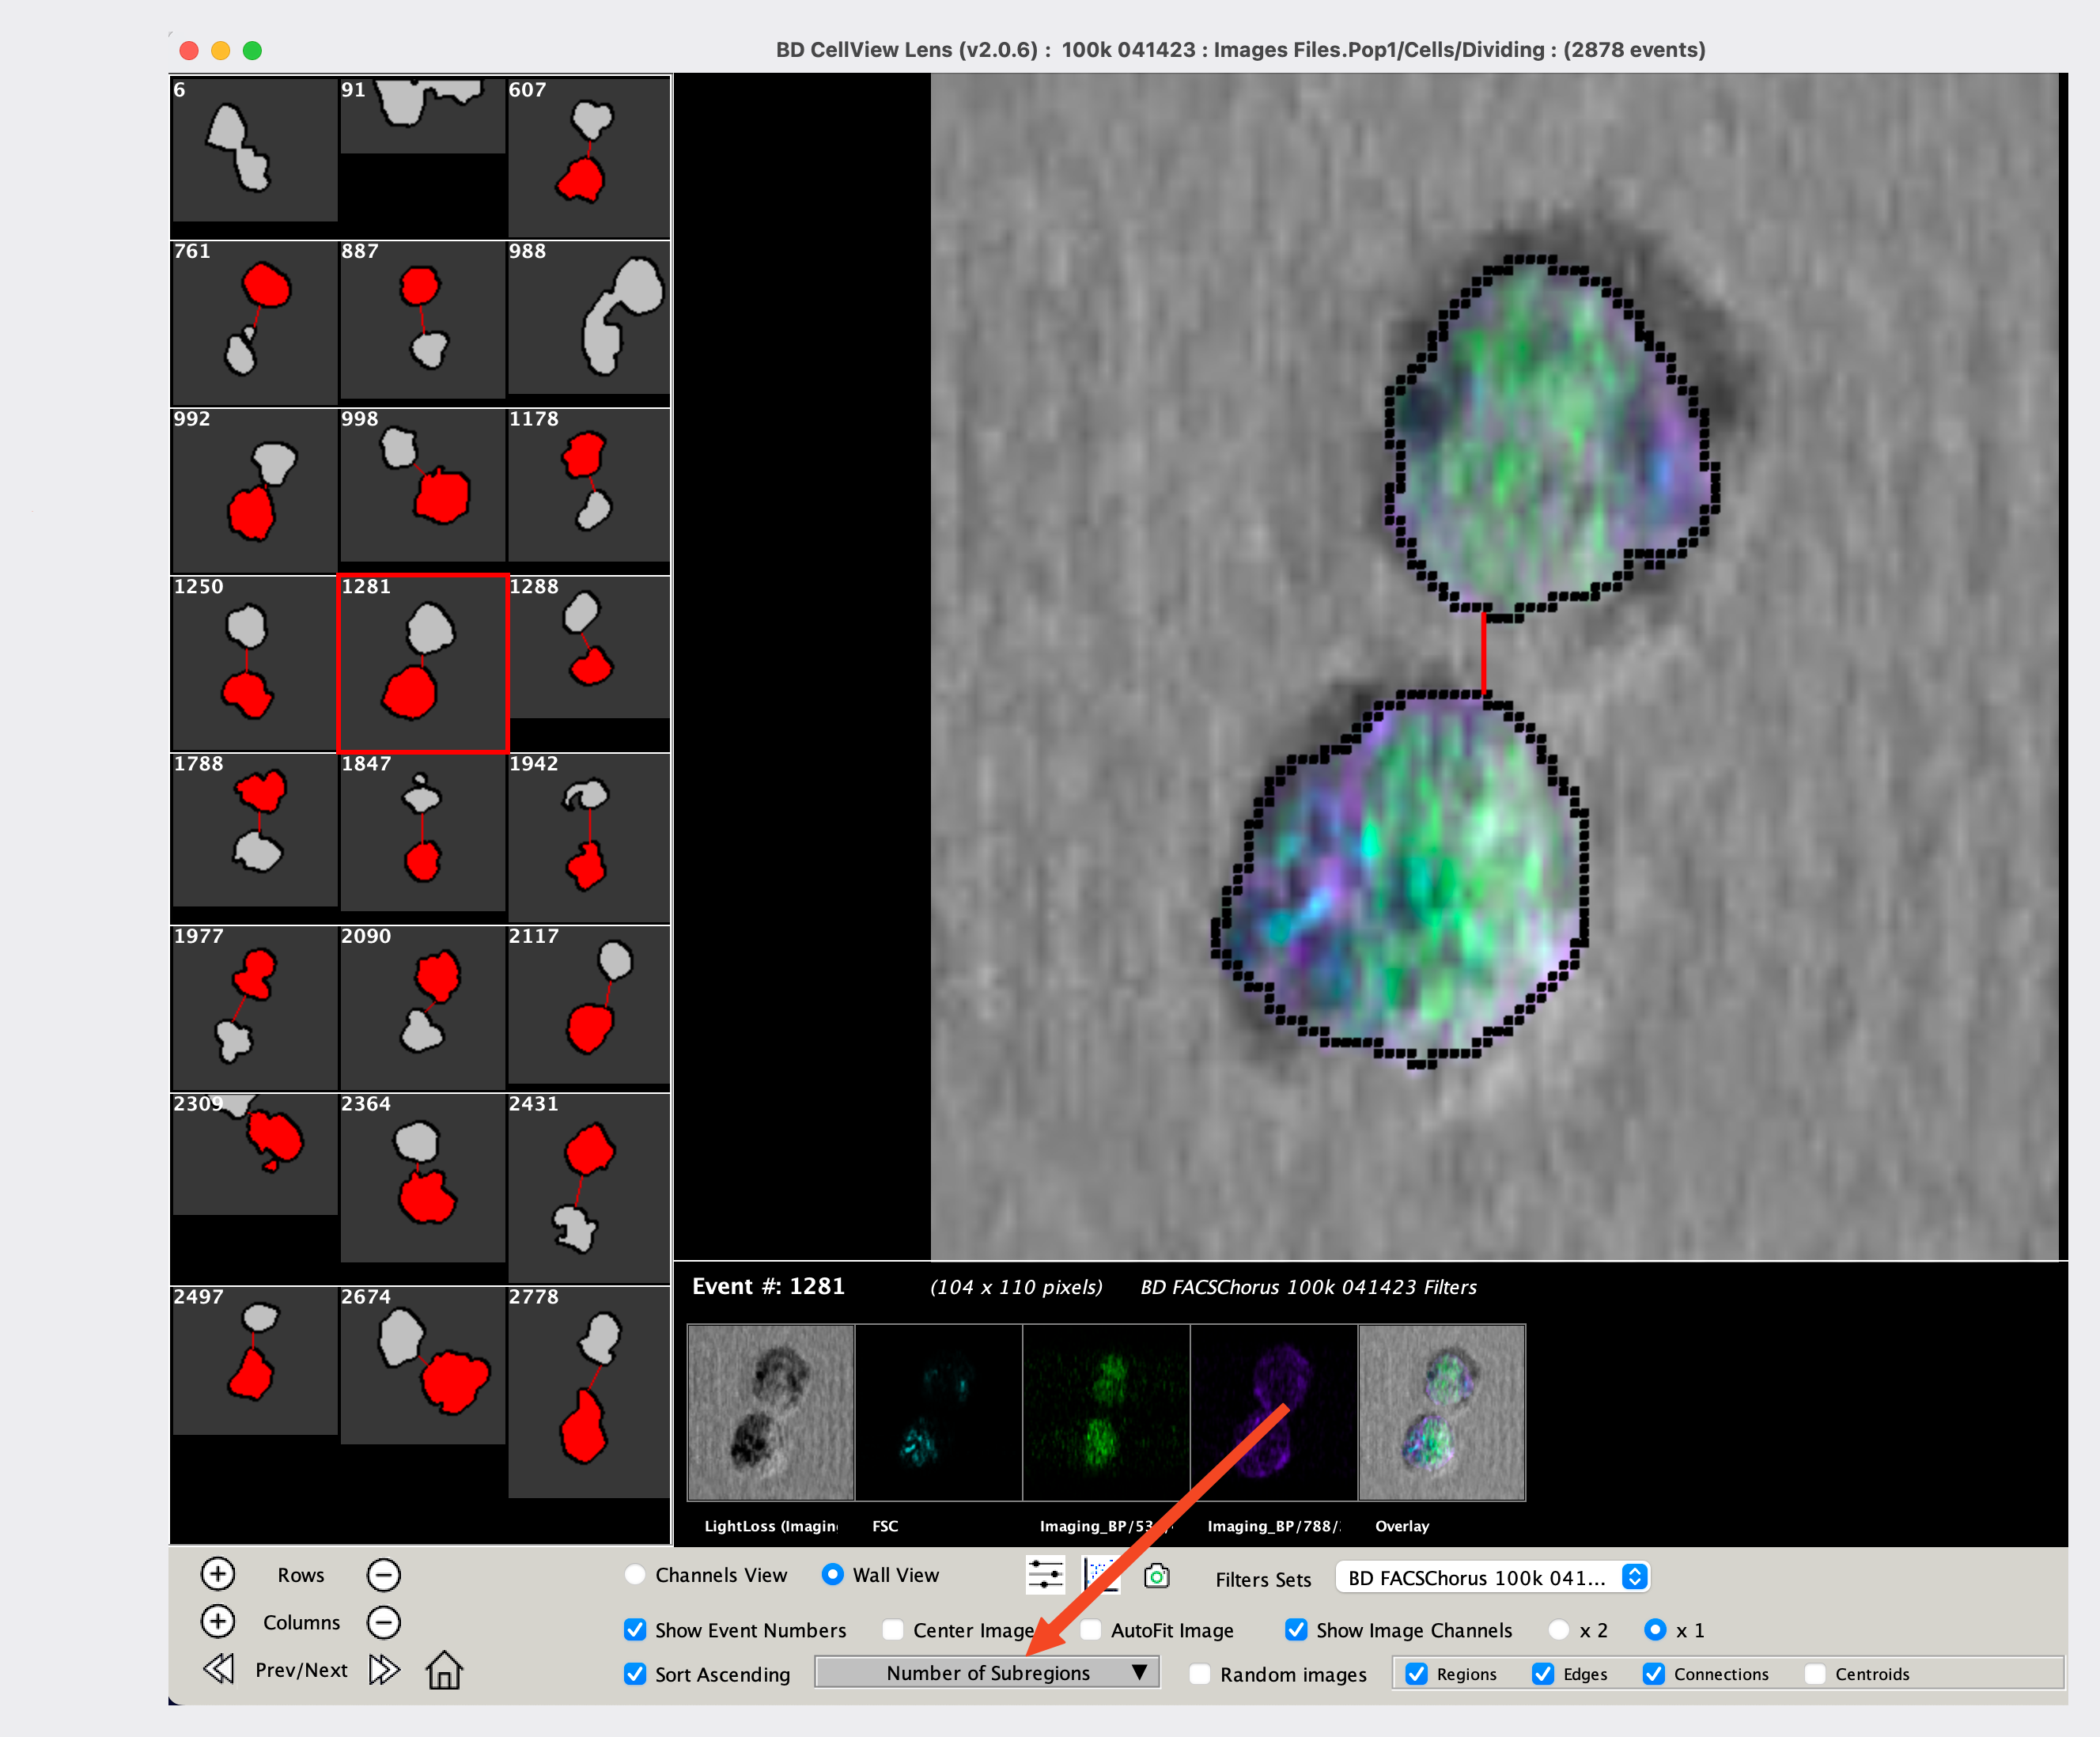
Figure 6 Sorting by Number of Regions
