The Spillover Spreading Matrix (SSM) is a measure of the performance of an instrument for a given panel. It reflects the Poisson-based error in fluorescence quantification.
An SSM is calculated from a set of single stain controls when a compensation matrix is calculated in the FlowJo 10 Compensation platform. SSMs will not be available for Acquisition-defined compensation matrices calculated on the acquisition cytometer software because the statistics needed to calculate each SSM value must be obtained from the single stain control data itself.
Calculating an SSM
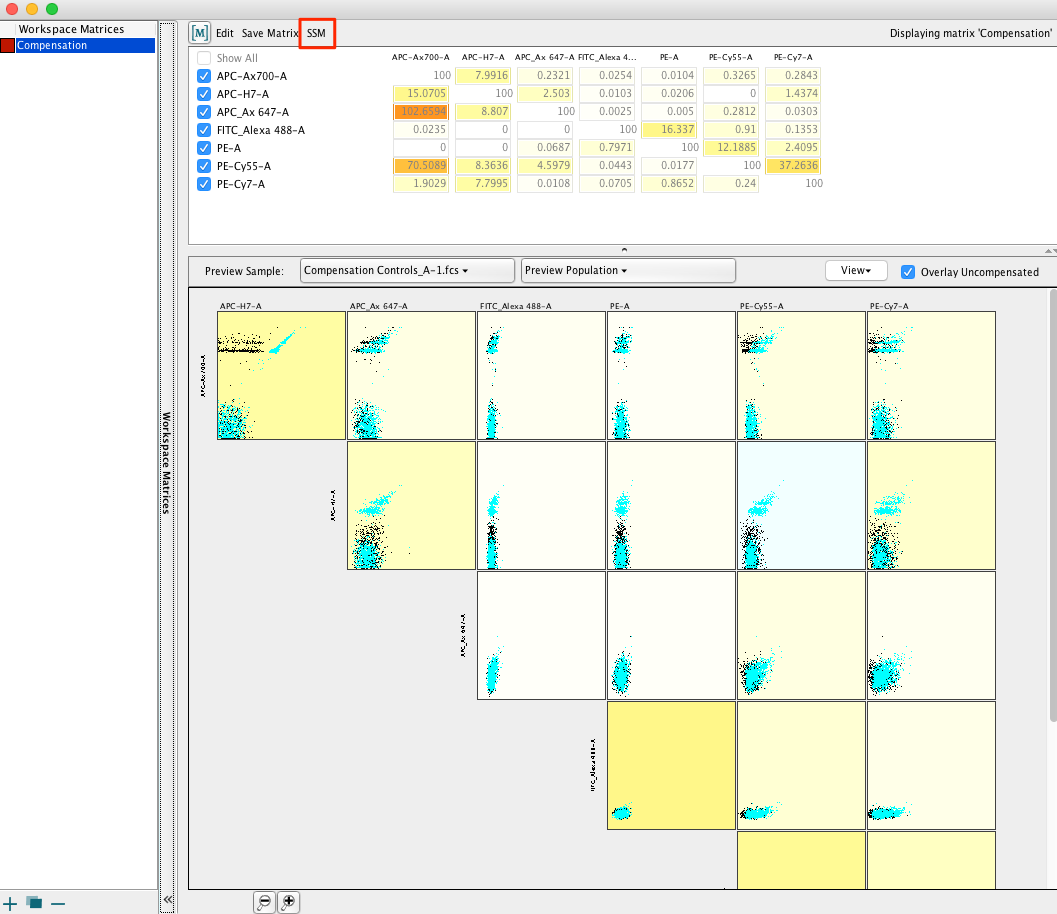
To access spillover spreading matrix in FlowJo, open the compensation editor, select the matrix of interest that was calculated from single stained controls in FlowJo, and click the “SSM” button. Select "Display SSM" to view the SSM in FlowJo. Select "Export SSM" to save the SSM values as a CSV file.

The Calculation
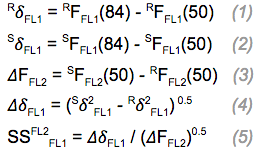
Spillover spreading is construed as the impediment of signal detectable above background, and is intrinsic to the configuration of a given instrument. The spillover spreading for a given detector/spillover-color pair can be calculated empirically by taking the square root of differences in squared robust standard deviations of measured fluorescence intensity from unstained negative and singly stained positive control populations:

Where:
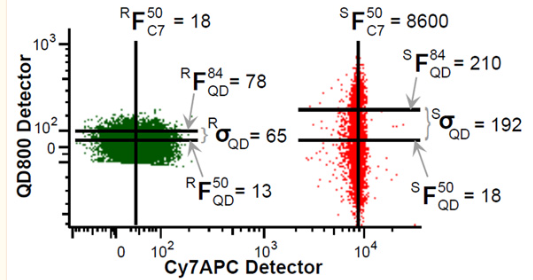
- R stands for ‘Reference’, meaning the FL2- population in this example
- S stands for ‘Stained’, meaning the FL2+ population in this example
- Sigma is standard deviation (adjusted to use 84th and 50th percentile)
- F is fluorescence in units of intensity
Here is a graphical example of those measures from Nguyen et. al.1

These values can be calculated for each detector staining pair, resulting in the spillover spreading matrix. The values within this matrix are not a percentage, but represent a standard deviation of spillover, AKA signal spread. The values in these matrices are directly comparable, though they only describe one part in a complex system which contributes to the quality of a flow panel.
Why Calculate SSM
- Quality control of instrument sensitivity – Since signal spreading directly effects channel sensitivity and results between similarly configured machines are readily comparable, the SSM can be used as a benchmark of configuration and performance quality control.
- Comparison between different instrument configurations – The measurement gives a PI or SRL manager the ability to quantifiably contrast between different cytometers and/or alternate arrangements of a given cytometer.
