Data preprocessing
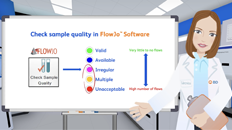
Quality control of data is an important step in your analysis workflow, especially when many parameters are measured and manually inspecting every combination of parameters would be tedious. The processes outlined below help remove technical artifacts from your data that could lead to false discoveries and prep your files for easier interpretation.
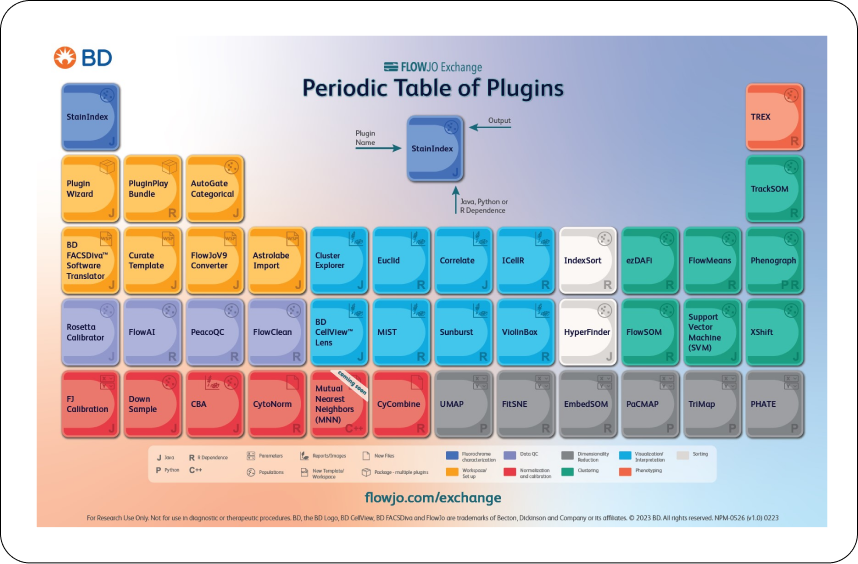
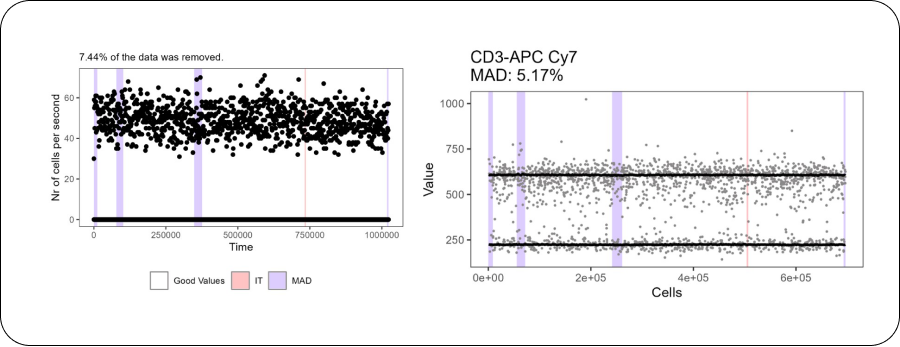
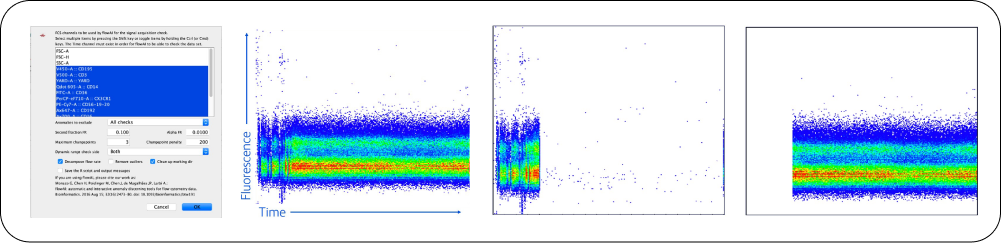
Technical issues at the cytometer can introduce questionable events into your files, lowering the quality of the data. Algorithms such as FlowClean, FlowAI and PeacoQC, all enabled as FlowJo™ Software plugins, automatically identify and remove “bad events” in your FCS files by tracking data consistency over time. FlowAI or FlowClean are best run on uncompensated data.
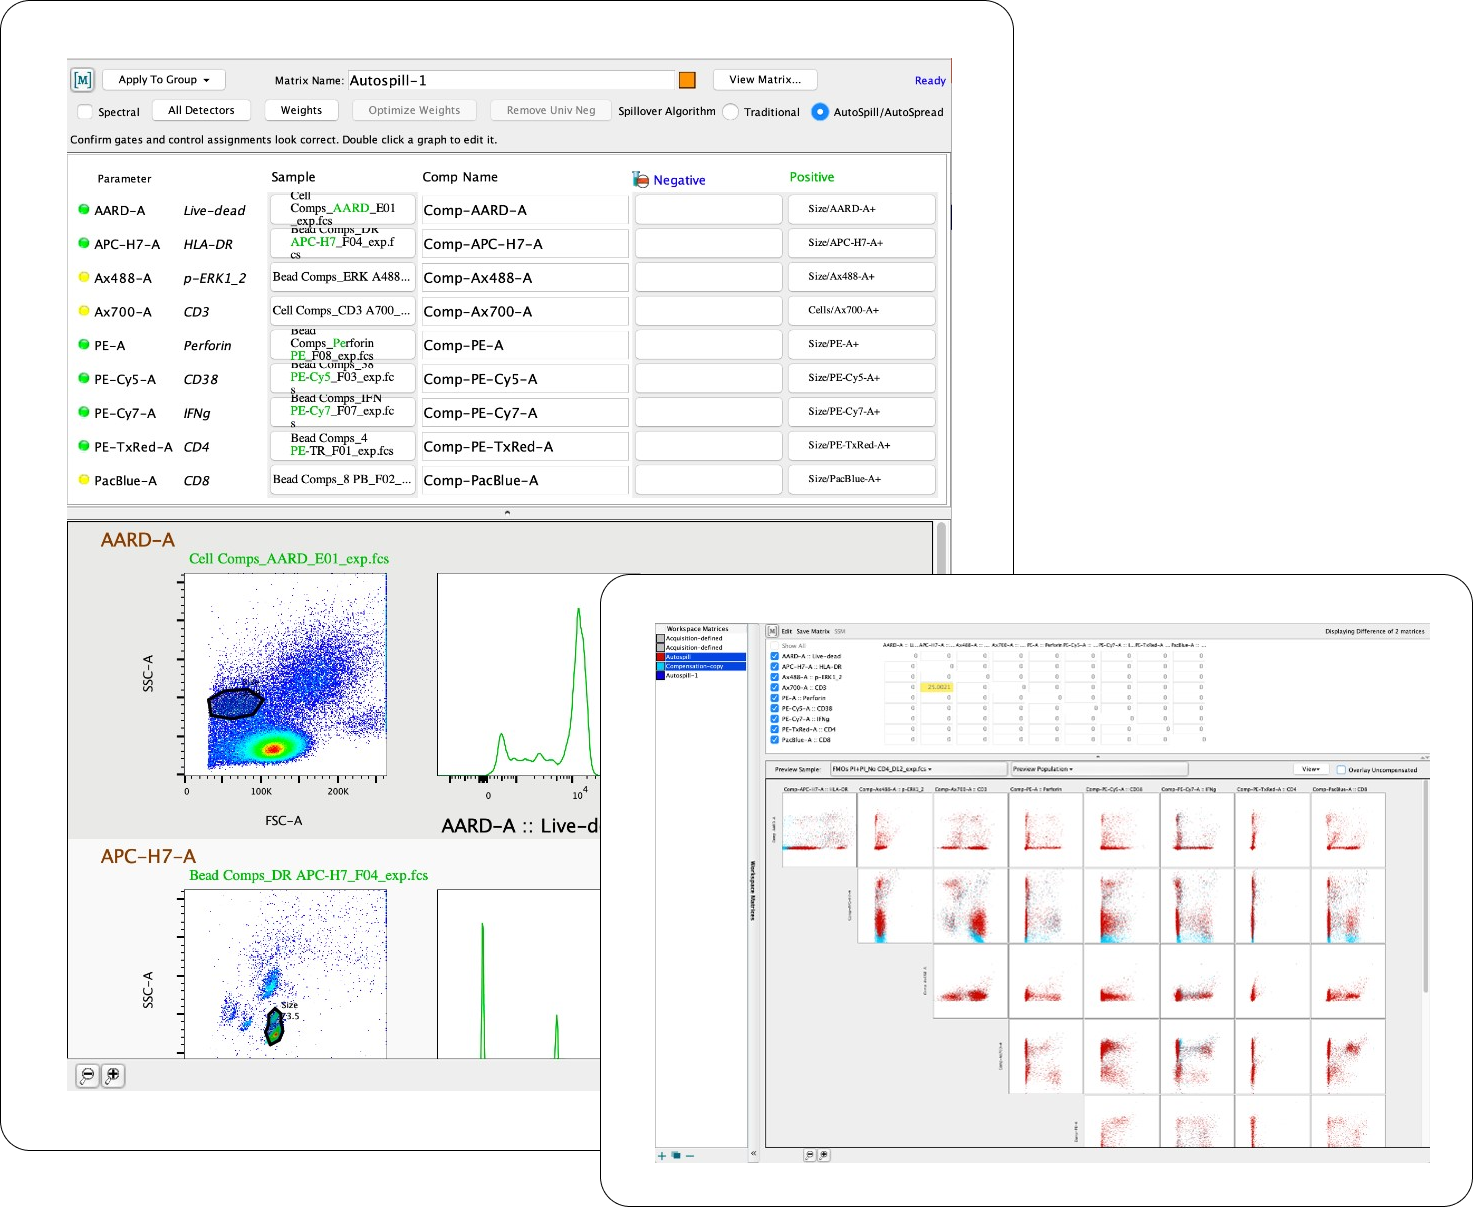
Compensate and transform raw data into a format suitable for analysis.
For either a traditional or spectral process to correct for spillover, FlowJo™ Software has several options to ameliorate high-parameter compensation. AutoSpill for example uses robust linear regression to calculate spillover coefficients for automatic gating thereby eliminating many steps in the compensation workflow. For more information, check our AutoSpill/AutoSpread flyer.
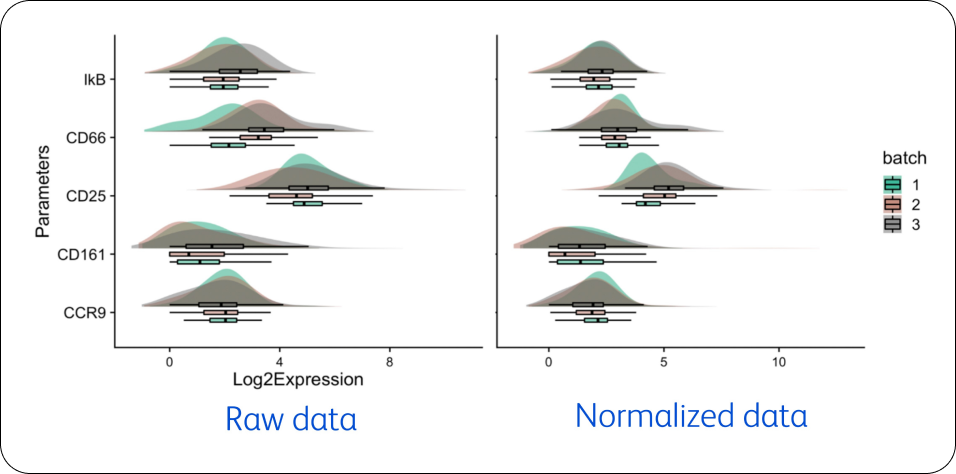
Normalization can be used to remove variance between batches due to differences in the cytometer, the staining protocol or operator inconsistencies. CytoNorm, CyCombine and MNN (Mutual Nearest Neighbors) minimize batch effects by modeling and correcting for technical variability between samples.
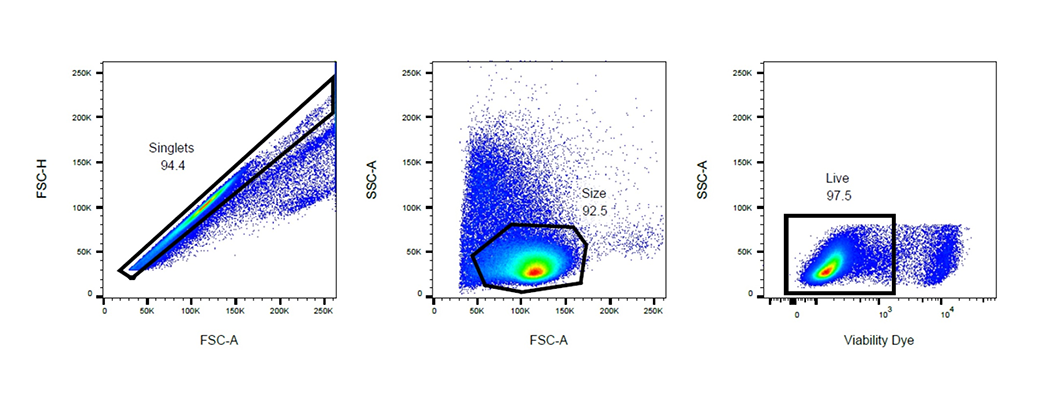
Continue with manual removal of irrelevant events, such as debris, doublets and marginal events. Apply appropriate gating strategies to define specific cell populations of interest.
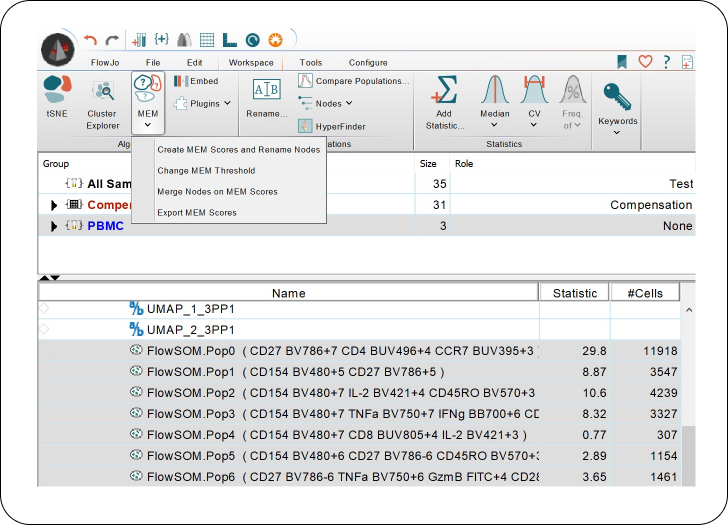
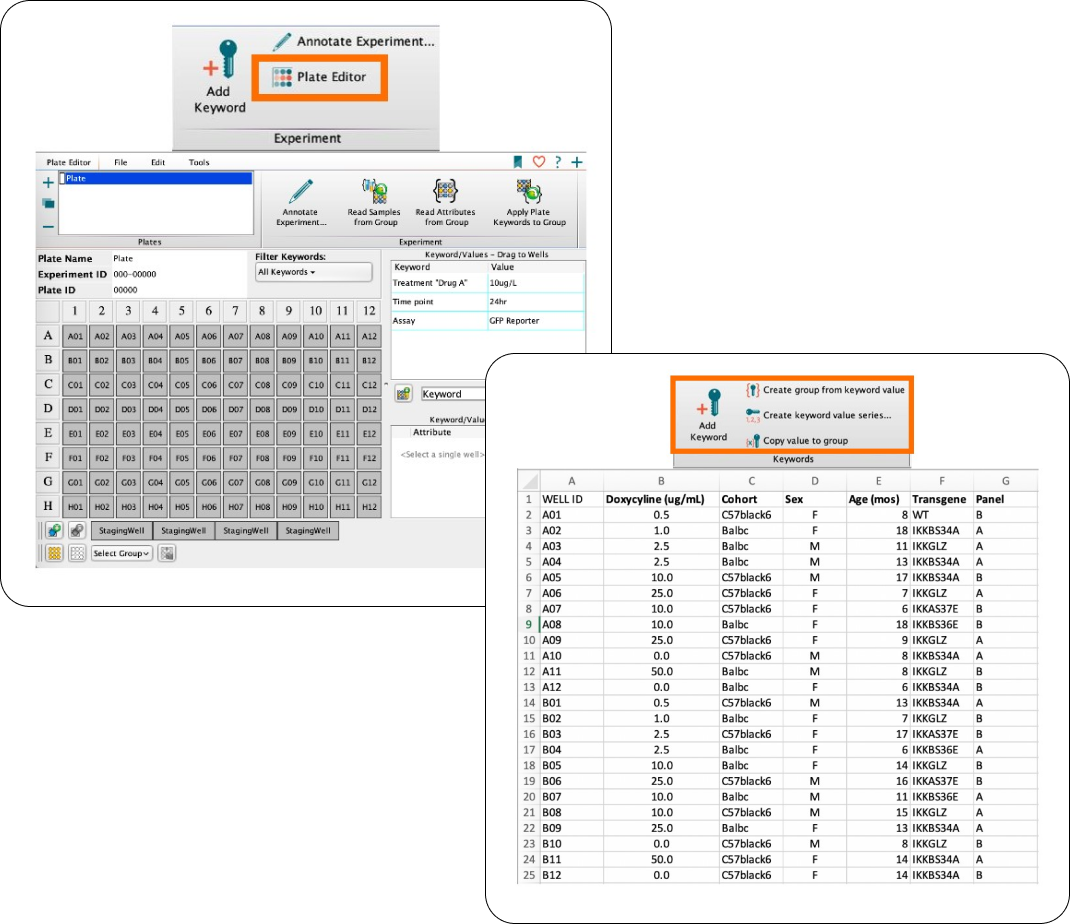
Meta-data, information about the data, can be added to your FCS files either at the time of collection using the acquisition software or post-acquisition in FlowJo™ Software. Keywords should describe experimental set up (timepoint, condition, tissue, etc.). Use the Plate Editor and Keywords band functions to add meta-data in FlowJo™ Software. Additionally, numeric keywords can be included as parameters and gated on in the Graph window.
Capture metadata in the context of the experiment and store/share instrument configuration for panel design in BD® Research Cloud.
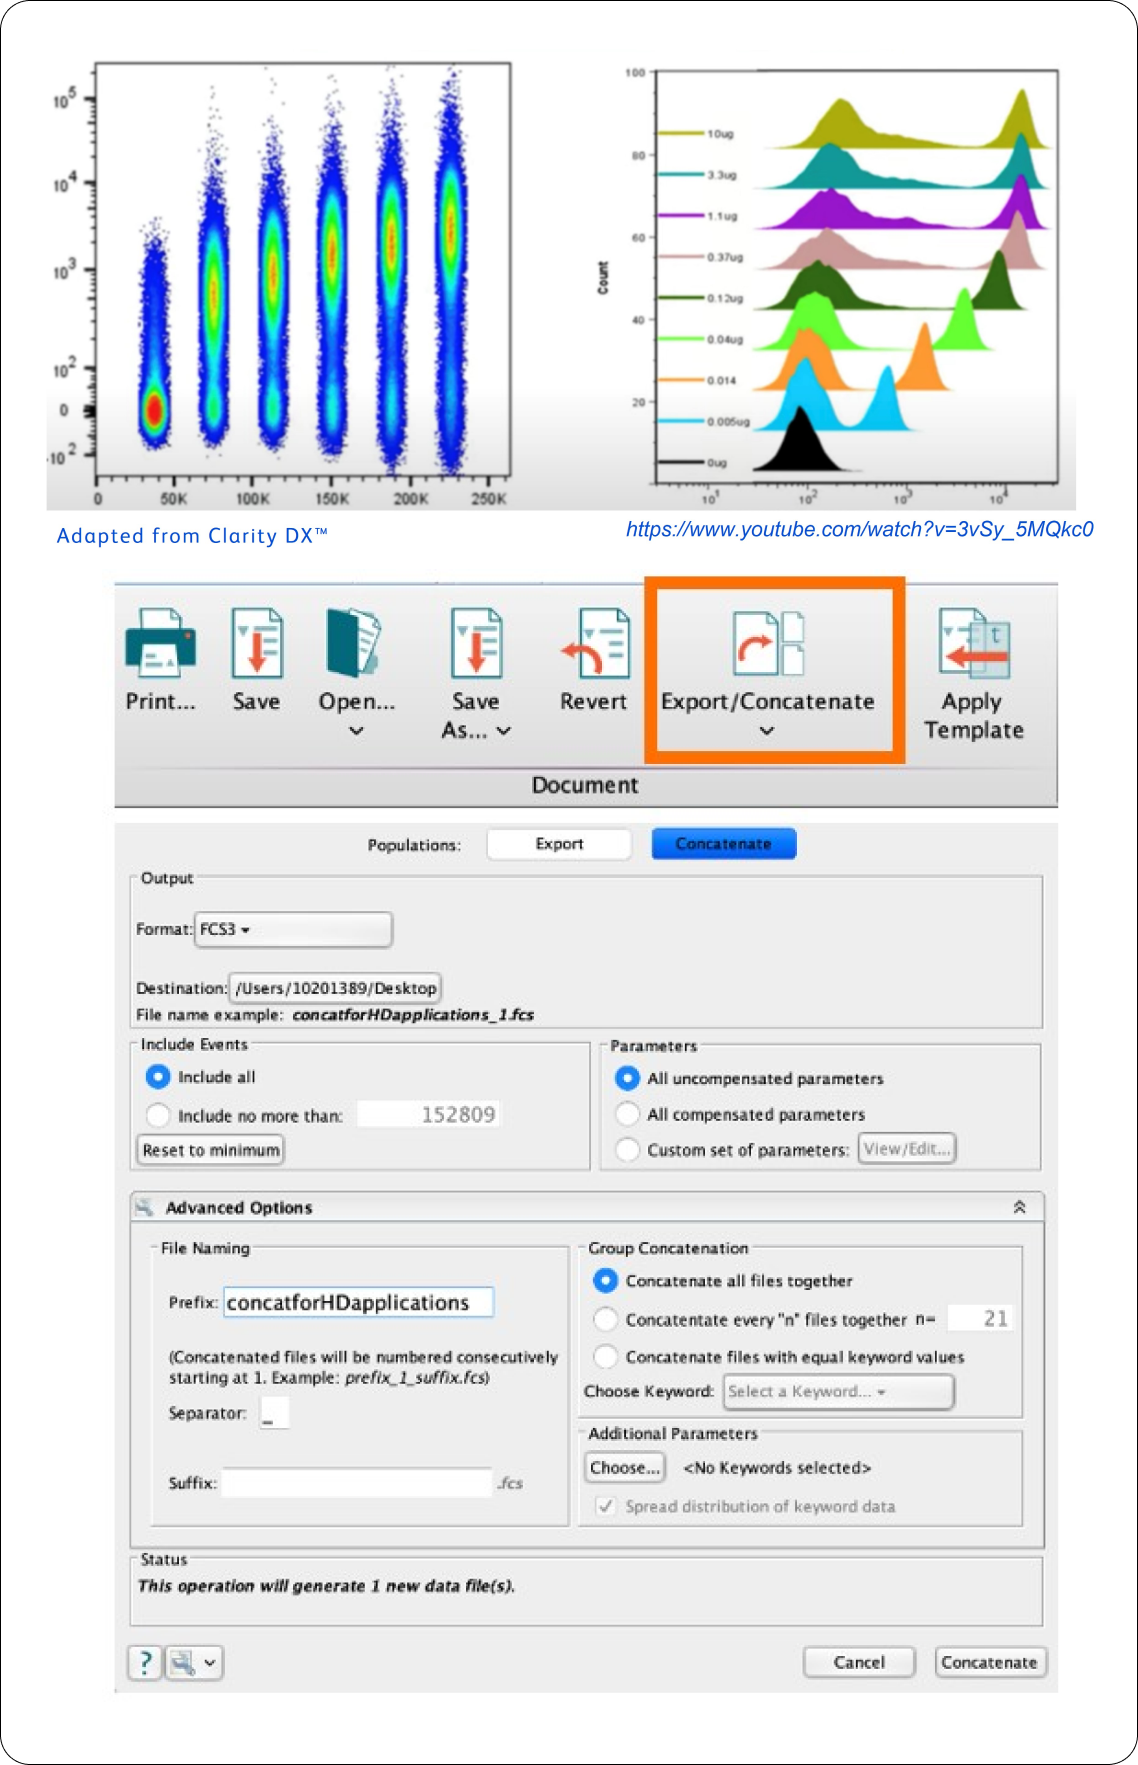
Merging multiple samples into a single concatenated file allows them to be computationally analyzed together and directly compared. Samples can be separated later by gating on keyword-based parameters included in the merged file.